
Chart Patterns
35 entries · Reference library
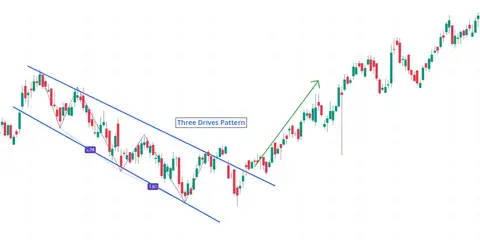
Three Drives Pattern
Three Drives = harmonic reversal pattern of three consecutive drives and two Fibonacci-based pullbacks.
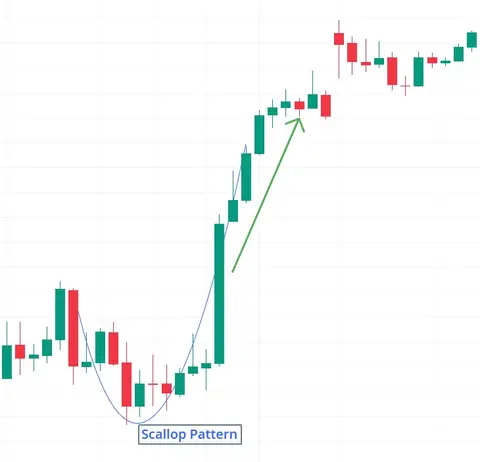
Scallop Pattern
Scallop (Seashell) = bullish continuation that pauses in a smooth U-shaped pullback before resuming the uptrend.
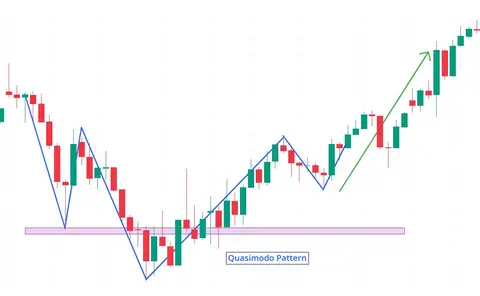
Quasimodo Pattern
Quasimodo (Over & Under) = failed Head-and-Shoulders structure validated by strict Fibonacci ratios (61.8 % / 78.6 %).
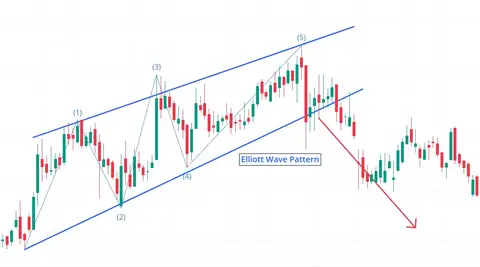
Elliott Wave Pattern
Elliott Wave Theory identifies fractal waves (Impulse 1-2-3-4-5 & Corrective A-B-C) that repeat across time-frames and align with Fibonacci ratios.
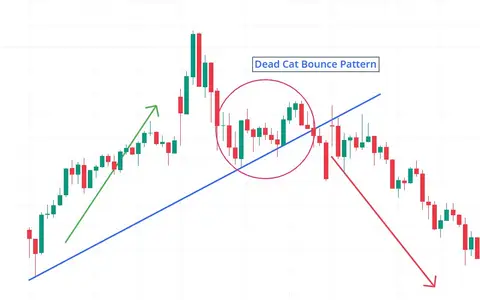
Dead Cat Bounce
Dead Cat Bounce = brief recovery (“bounce”) within a downtrend, followed by renewed decline.
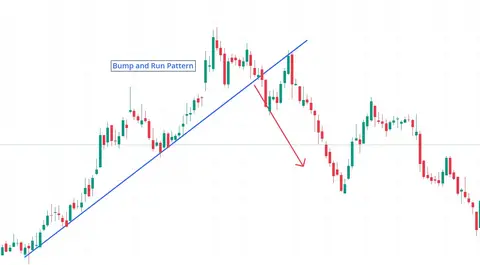
Bump and Run
Bump-and-Run = sharp “bump” (parabolic surge) followed by trendline break and “run” lower, signalling exhaustion of prevailing trend.
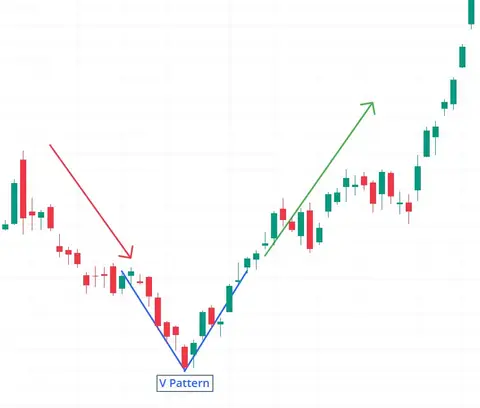
V Pattern
V Pattern = sharp reversal that forms a letter “V”: steep move in one direction followed by an equally sharp move in the opposite direction.
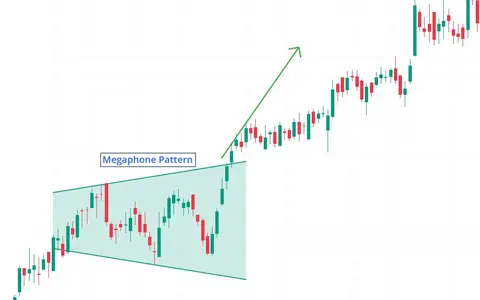
Megaphone Pattern
Megaphone Pattern = expanding highs and lows that create a “megaphone” shape and highlight rising volatility.
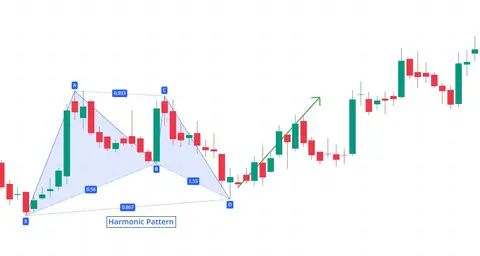
Harmonic Pattern
Harmonic Patterns = geometric price structures that leverage Fibonacci ratios (e.g., 0.618, 0.786, 1.13, 1.618) to pinpoint Potential Reversal Zones (PRZ).
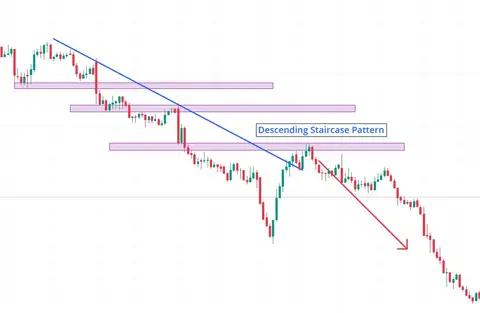
Descending Staircase
Descending Staircase = series of lower highs & lower lows with brief rallies, forming “steps” in a downtrend.
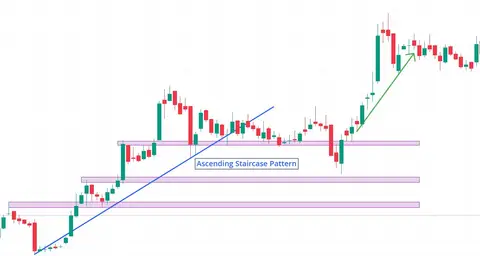
Ascending Staircase
Ascending Staircase = series of higher highs & higher lows with short pullbacks, forming “steps” inside an uptrend.
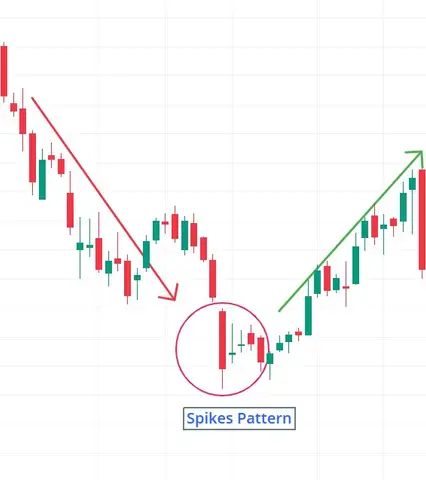
Spikes Pattern
Spikes Pattern = 1–3 candles with exceptionally long wicks and small bodies, showing strong rejection of extremes.
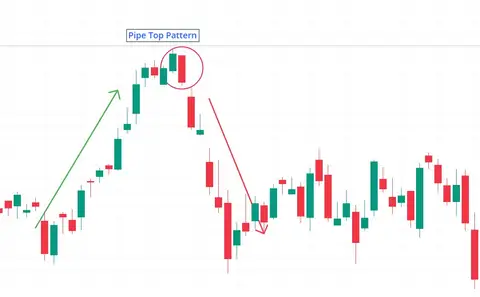
Pipe Top Pattern
Pipe Top = 2–3-candle bearish reversal that appears at the peak of an uptrend.
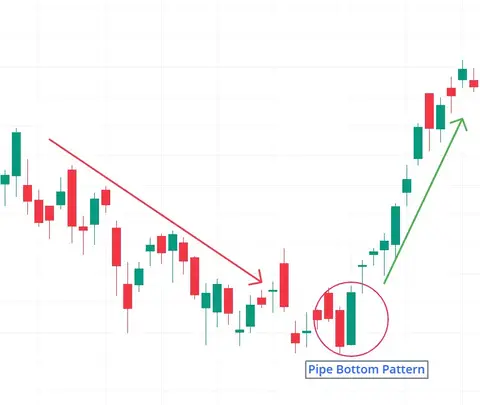
Pipe Bottom
Pipe Bottom = short-term bullish reversal that appears at the end of a downtrend and consists of two–three candles.
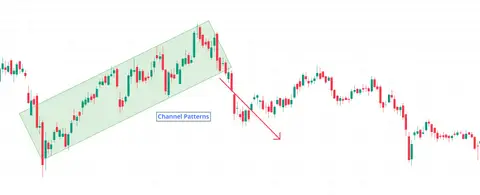
Channel Patterns
Price oscillates between two parallel trend-lines (support & resistance) forming a channel.
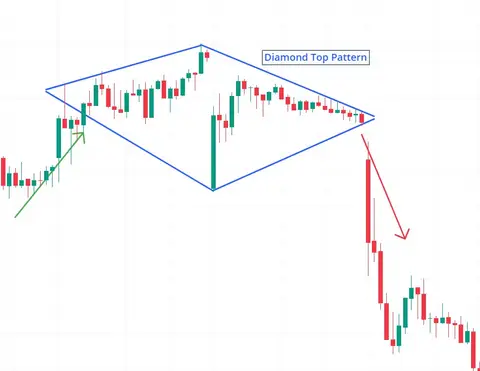
Diamond Top
Diamond Top = expanding then contracting price formation after an uptrend; warns of bullish-to-bearish trend change.
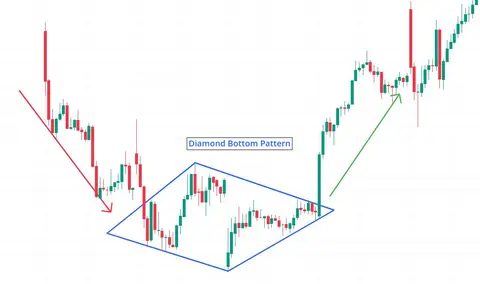
Diamond Bottom
Diamond Bottom = expanding‐then-contracting formation after a downtrend; signals transition from bearish to bullish sentiment.
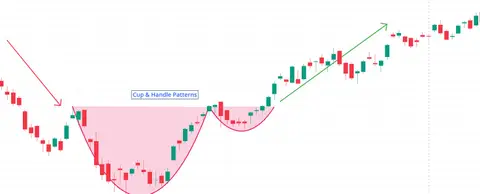
Cup & Handle
Cup & Handle = bullish continuation formation shaped like a teacup followed by a short “handle” consolidation.
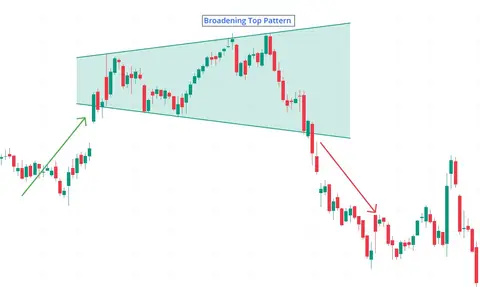
Broadening Top
Broadening Top = expanding formation with higher highs & lower lows, reflecting increasing indecision; typically ends an uptrend.
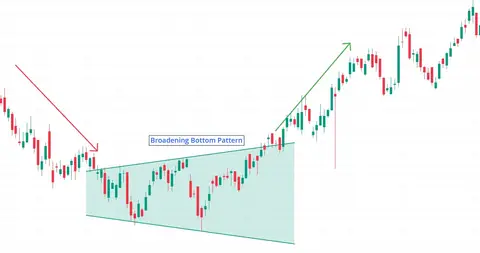
Broadening Bottom
Broadening Bottom = expanding, megaphone-like formation after a downtrend; often flips sentiment from bearish to bullish.
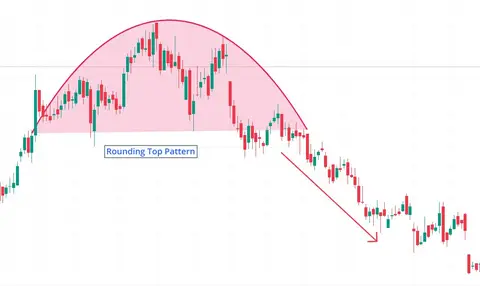
Rounding Top
Rounding Top = smooth, hill-shaped pattern that ends an uptrend and signals transition to bearish control.
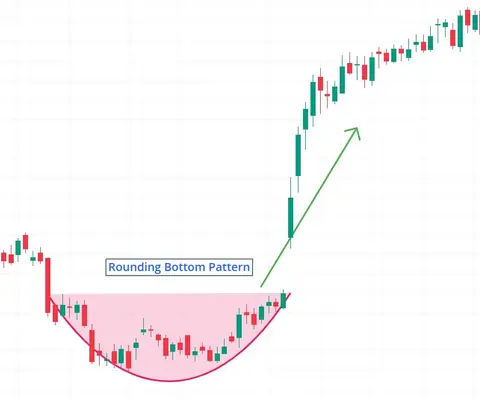
Rounding Bottom
Rounding Bottom = smooth, bowl-shaped reversal pattern signaling shift from bearish to bullish control.
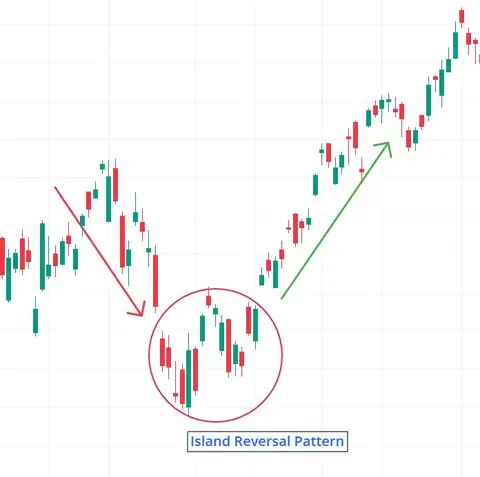
Island Reversal
Island Reversal = reversal pattern with an “island” of isolated price action between two opposite-direction gaps.
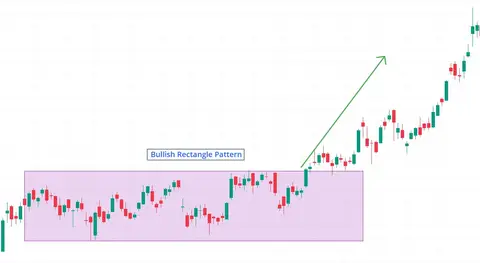
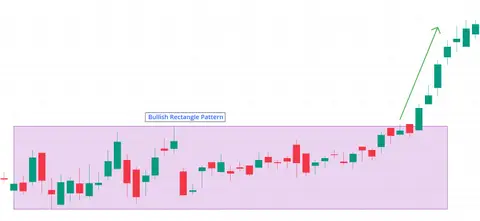
Bullish Rectangle
Bullish Rectangle = sideways consolidation within an uptrend; breakout signals trend resumption higher.
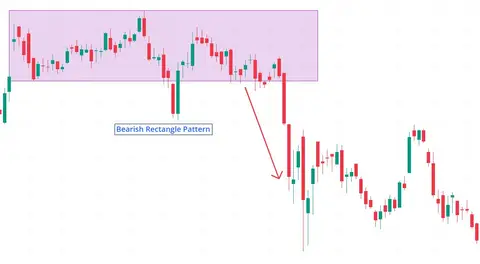
Bearish Rectangle
Bearish Rectangle = consolidation pause inside a downtrend; signals trend continuation lower once support breaks.
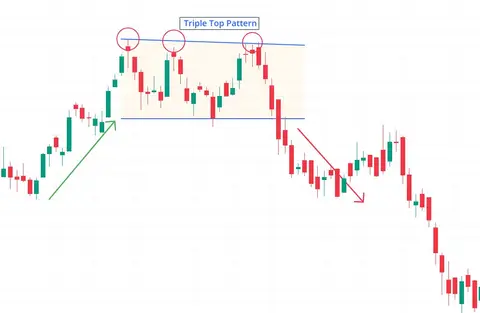
Triple Top
Triple Top = bearish reversal pattern after an uptrend; signals buyer exhaustion and potential trend change.
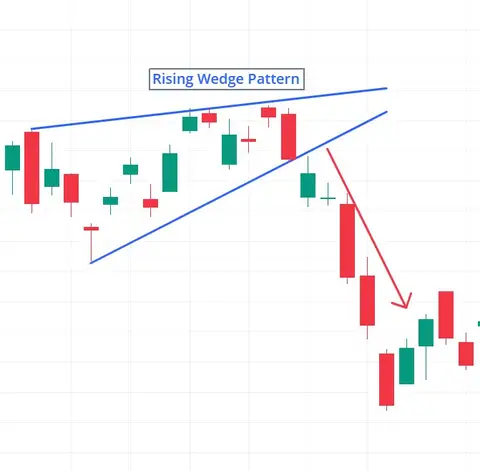
Rising Wedge
Bearish chart pattern with two converging upward-sloping trend-lines (higher highs & higher lows) forming a wedge.
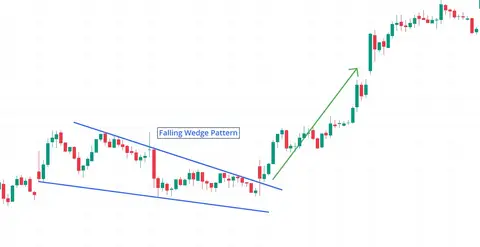
Falling Wedge
Bullish reversal (common) or continuation (rare) pattern with two converging downward trend-lines; lower line steeper.
Bullish Flag
Short-term continuation pattern: small rectangular “flag” against the prevailing uptrend.
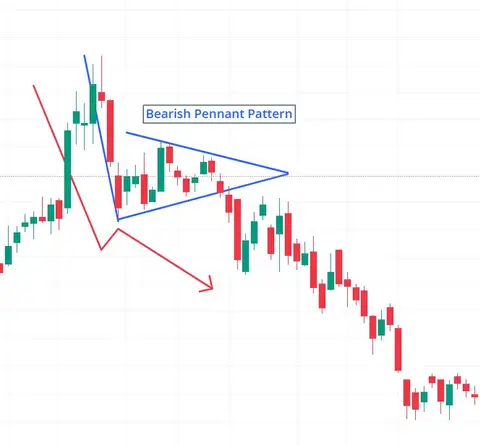
Bearish Flag
Short-term bearish continuation pattern: small upward-sloping “flag” channel inside a dominant downtrend.
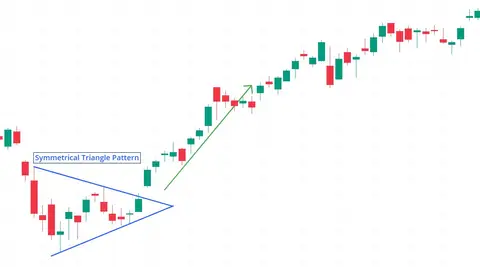
Symmetrical Triangle
Formed by converging trend-lines connecting lower highs and higher lows, creating a symmetrical triangle.
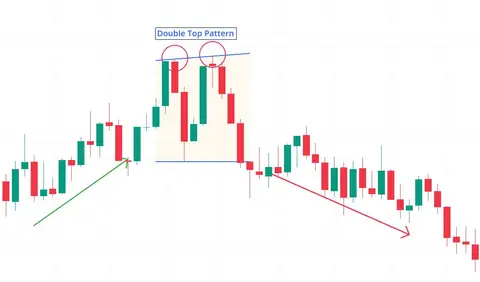
Double Top
Bearish reversal pattern with two similar highs separated by a trough (neckline).
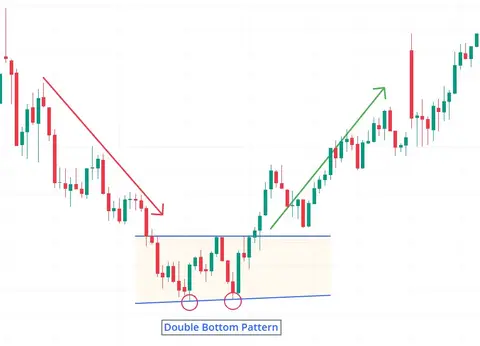
Double Bottom
Bullish reversal pattern formed by two distinct lows and a breakout above the intervening peak (neckline).
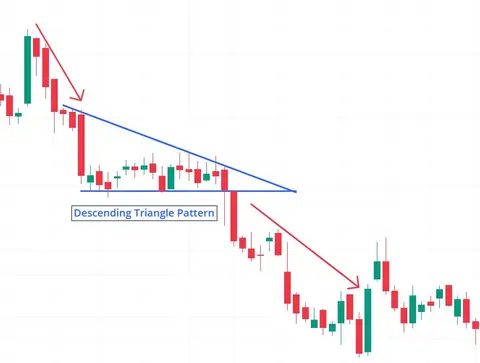
Descending Triangle
Bearish continuation pattern with flat support and descending resistance.
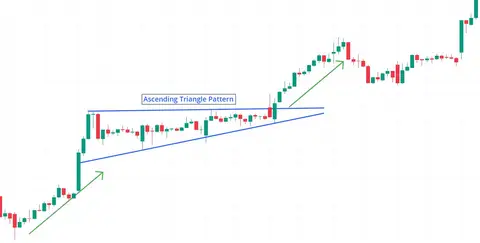
Ascending Triangle
Bullish continuation pattern featuring a flat resistance line and rising trendline of higher lows.