
Chart Pattern
Bullish Flag बुलिश फ्लैग
Short-term continuation pattern: small rectangular “flag” against the prevailing uptrend. अपट्रेंड के भीतर बनता छोटा आयताकार सुधार (फ्लैग) – बुलिश कंटिन्यूएशन पैटर्न।
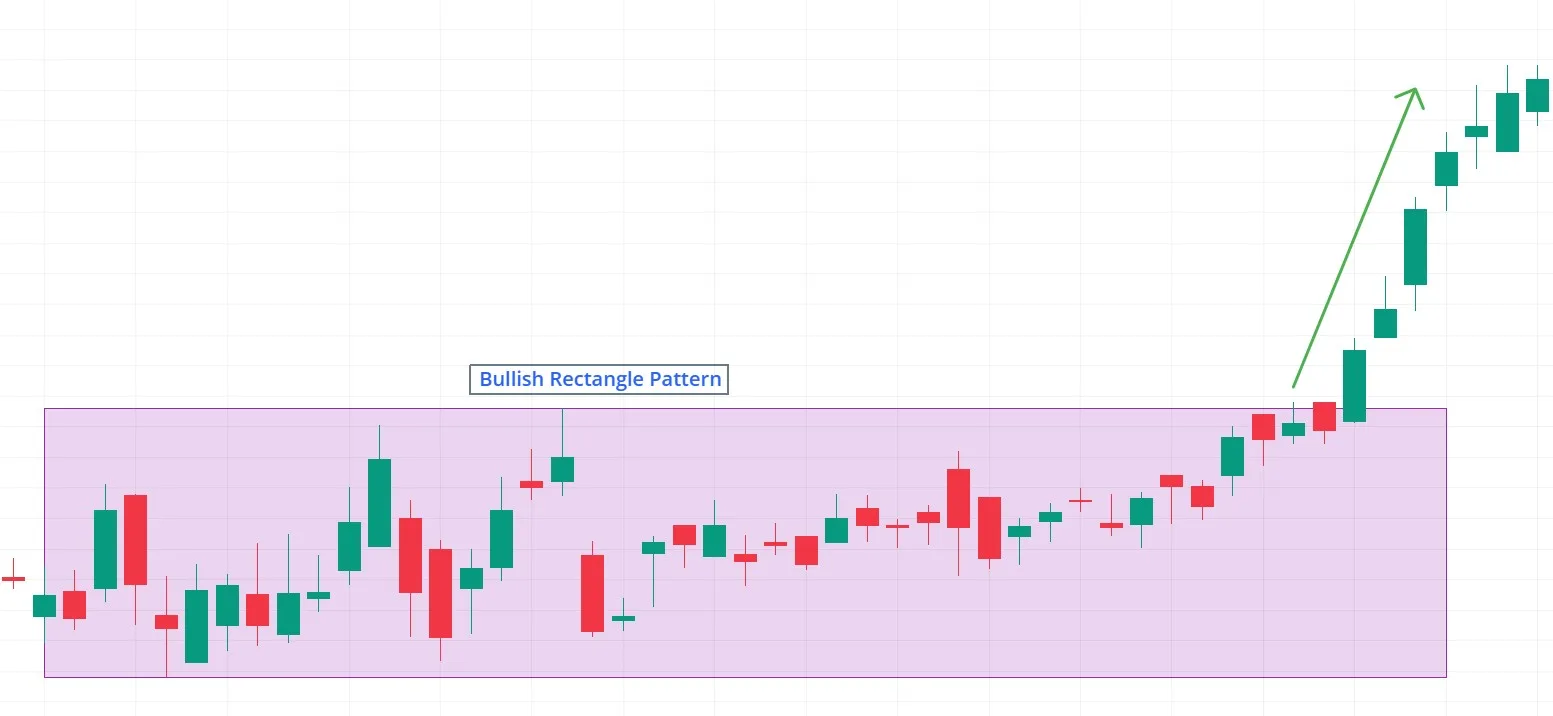
Pattern Overview
Definition & Classification
- Short-term continuation pattern: small rectangular “flag” against the prevailing uptrend.
- Continuation – forms within existing uptrends.
- Bullish – signals resumption of upward move.
Reliability
- High in established uptrends.
- Most reliable on daily / weekly charts.
Formation & Structure
Visual Components
- Timeframe: 1–3 weeks (≈5–20 candles).
- Flagpole – sharp price rise on heavy volume.
- Flag – parallel channel with slight down / sideways slope.
- Volume falls during flag, surges on breakout.
Identification Rules
- Must follow strong upward flagpole.
- Channel boundaries nearly parallel.
- Retracement ≤ 50 % of flagpole height for validity.
Psychological Interpretation
- Initial surge shows strong buying enthusiasm (flagpole).
- Flag = temporary profit-taking; breakout → renewed buying pressure.
- Trader Behavior:
- Early buyers trim profits in flag.
- New buyers enter during consolidation.
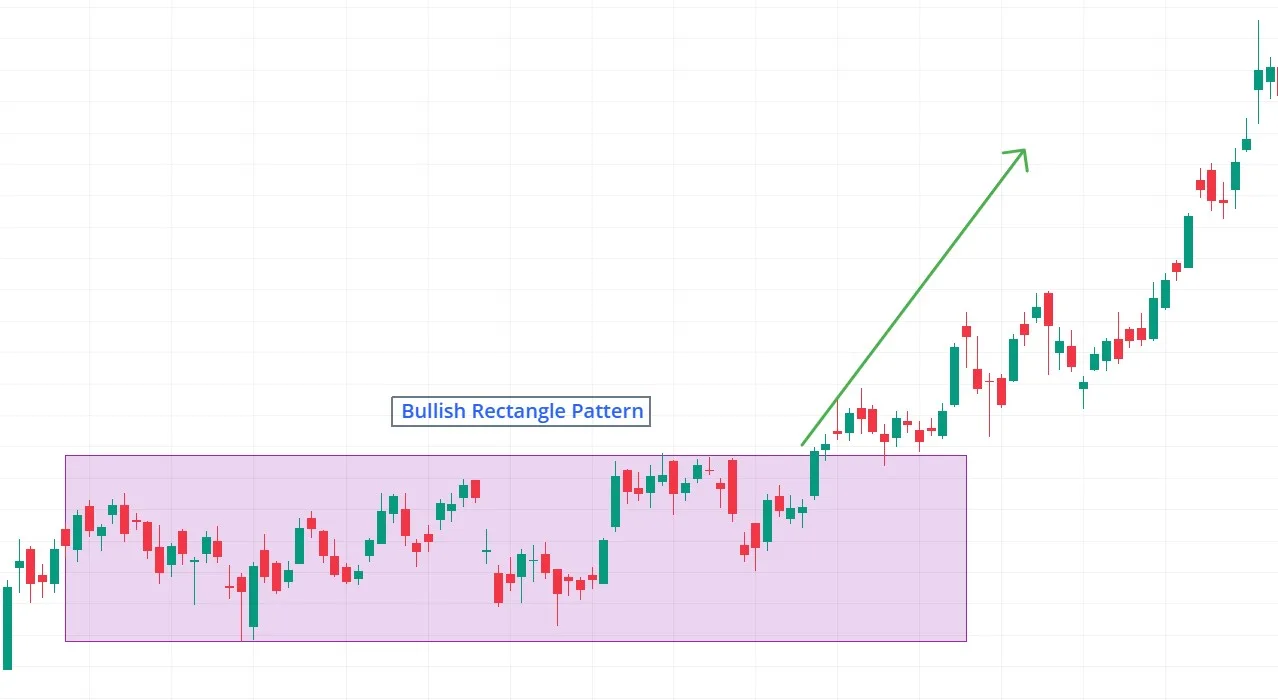
Real-World Example
- XYZ rallies $100 → $150 (flagpole), consolidates $145–148 (flag).
- Breakout above $148 on 2× volume, MACD positive → target $180 (measured move).
Strategic Insights
Entry & Confirmation
- Close above upper trend-line with ≥ 1.5× volume.
- Momentum indicators: RSI > 50, MACD bullish crossover support breakout.
Trigger & Targets
- Trigger: 1–2 % close above flag resistance.
- Targets:
- Measured move – flagpole height projected from breakout.
- Next significant resistance levels.
Risk Management
- Risk 1–2 % of account per trade.
- Stop-loss: below flag’s lowest point or recent swing low.
- Pro Tip: Scale in – start partial on breakout, add on retest.
Common Pitfalls & Cautions
Frequent Issues
- False breakouts → wait for volume & close confirmation.
- Flag too deep (> 61.8 % retrace) weakens setup.
- Breakout on low volume → lower success probability.
Variations & Similar Patterns
Comparable Patterns
- Bear Flag – mirror image in downtrends.
- Pennant – converging trend-lines vs. parallel.
- Unique aspect → parallel boundaries distinguish flag from wedges.
Quiz: Trader Knowledge Check
True or False
- The flag portion should retrace more than 61.8 % of the flag-pole.
- (Answer: False – ideal 38.2–50 %.)
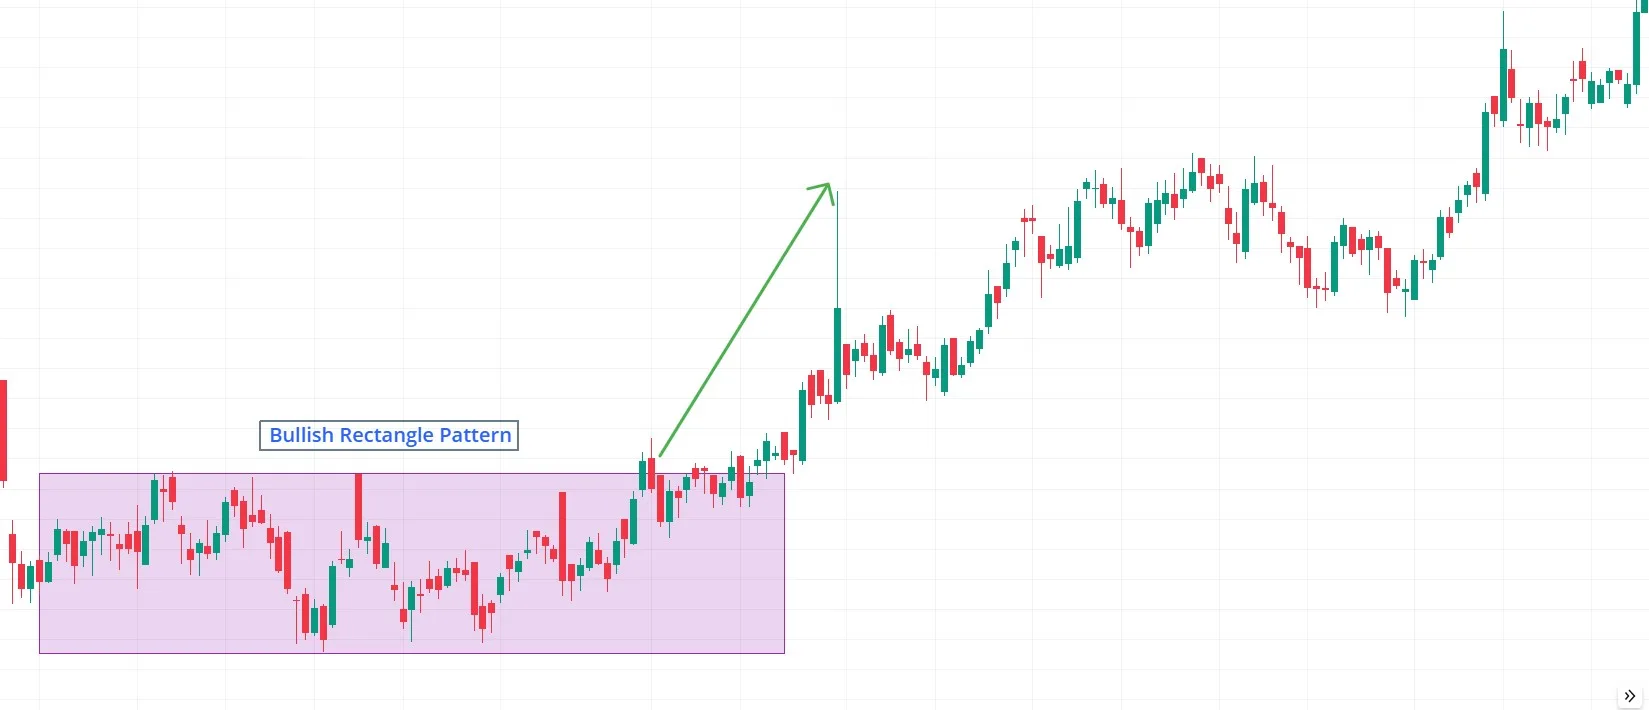
पैटर्न का सिंहावलोकन
परिभाषा व वर्गीकरण
- अपट्रेंड के भीतर बनता छोटा आयताकार सुधार (फ्लैग) – बुलिश कंटिन्यूएशन पैटर्न।
- कंटिन्यूएशन – मौजूदा तेजी के बीच बनता है।
- बुलिश – ऊपर की दिशा में ब्रेकआउट का संकेत।
विश्वसनीयता
- स्थिर अपट्रेंड में उच्च।
- दैनिक / साप्ताहिक चार्ट पर सबसे विश्वसनीय।
बनावट और संरचना
दिखावट
- समय: 1–3 सप्ताह (≈5–20 कैंडल्स)।
- फ्लैगपोल – तेज़ वृद्धि, ऊँचा वॉल्यूम।
- फ्लैग – समानांतर चैनल, हल्की नीचे / साइडवेझ ढलान।
- फ्लैग में वॉल्यूम घटता, ब्रेकआउट पर बढ़ता है।
सख्त मानदंड
- मजबूत अपट्रेंड (फ्लैगपोल) आवश्यक।
- ट्रेंडलाइन्स लगभग समानांतर हों।
- फ्लैगपोल का ≤ 50 % रिट्रेस – अधिक होगा तो मान्य नहीं।
मनोवैज्ञानिक व्याख्या
- फ्लैगपोल पर मजबूत खरीद उत्साह।
- फ्लैग = अस्थायी मुनाफ़ा-वसूली; ब्रेकआउट पर नयी खरीद शुरू।
- ट्रेडर व्यवहार:
- पहले खरीदार आंशिक प्रोफ़िट बुक करते हैं।
- नई खरीद कंसॉलिडेशन में प्रवेश करती है।
वास्तविक उदाहरण
- XYZ $100 → $150 चढ़ता है (फ्लैगपोल), फिर $145–148 में फ्लैग बनाता है।
- $148 के ऊपर 2× वॉल्यूम पर ब्रेकआउट, MACD पॉज़िटिव → लक्ष्य $180।
रणनीतिक सुझाव
प्रवेश और पुष्टि
- ऊपरी ट्रेंडलाइन के ऊपर क्लोज + ≥ 1.5× वॉल्यूम।
- RSI > 50, MACD बुलिश क्रॉसओवर से पुष्टि करें।
ट्रिगर व लक्ष्य
- ट्रिगर: रेजिस्टेंस के 1–2 % ऊपर क्लोज।
- लक्ष्य:
- फ्लैगपोल की ऊँचाई ब्रेकआउट से जोड़ें।
- अगला प्रमुख रेजिस्टेंस।
जोखिम प्रबंधन
- प्रति ट्रेड 1–2 % पूंजी जोखिम।
- स्टॉप-लॉस: फ्लैग के निम्नतम बिंदु या हाल के स्विंग लो के नीचे।
- प्रो टिप: ब्रेकआउट पर आंशिक एंट्री, रीटेस्ट पर जोड़ें।
सामान्य गलतियाँ
आम समस्याएँ
- झूठे ब्रेकआउट – वॉल्यूम व क्लोज कन्फर्म करें।
- फ्लैग > 61.8 % रिट्रेस हो तो सेटअप कमज़ोर।
- कम वॉल्यूम ब्रेकआउट पर भरोसा न करें।
विविधताएँ व समान पैटर्न
तुलनीय पैटर्न
- बेयरिश फ्लैग – डाउनट्रेंड में उल्टा रूप।
- पेननेंट – अभिसरण ट्रेंडलाइन्स।
- समानांतर ट्रेंडलाइन्स – वेज से अंतर।
क्विज़: व्यापारी ज्ञान परीक्षण
True or False
- सही या गलत: फ्लैग 61.8 % से ज़्यादा रिट्रेस होना चाहिए।
- (उत्तर: गलत – 38.2–50 % आदर्श)।