
Indicators
10 entries · Reference library
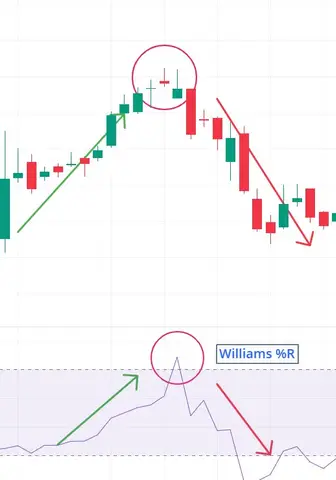
Williams %R
Momentum oscillator that pinpoints where current price sits within the highest-high / lowest-low range of a chosen look-back period.
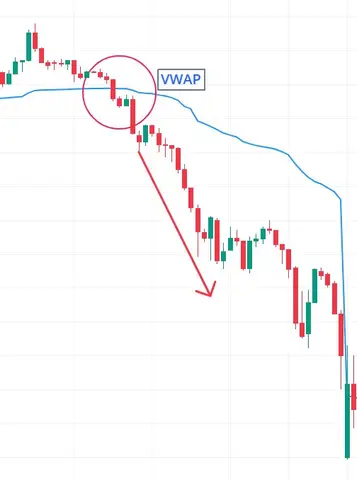
Volume Weighted Average Price (VWAP)
Volume-Weighted Average Price (VWAP) displays the average trading price of a session, weighted by volume—showing where most capital changed hands.
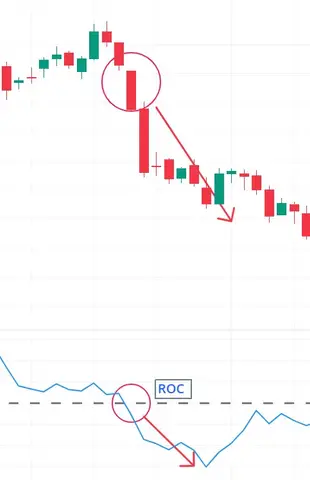
Rate of Change (ROC)
Rate of Change (ROC) shows how fast price has moved by plotting the percentage difference between today’s price and the price X periods ago.
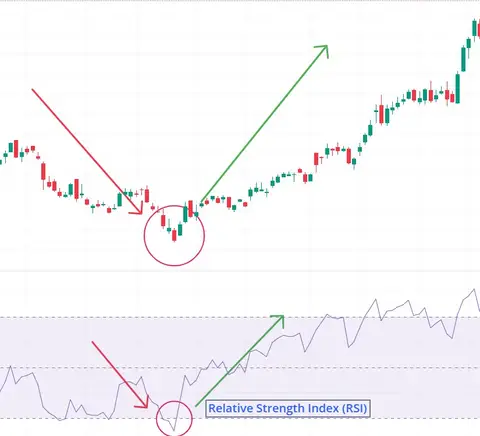
Relative Strength Index (RSI)
Relative Strength Index (RSI) quantifies the speed and magnitude of recent price changes to gauge momentum.
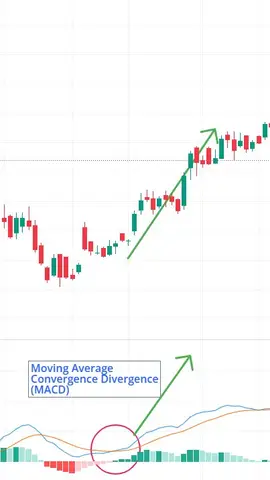
Moving Average
Moving Averages smooth price data, filtering short-term noise to reveal the underlying trend over a chosen period.
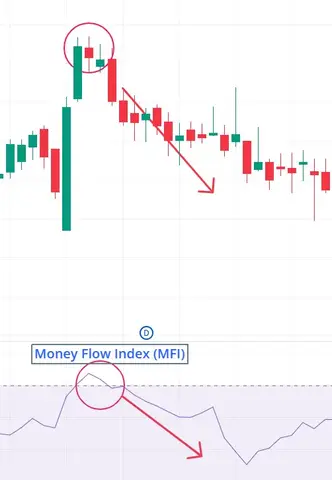
Money Flow Index (MFI)
Money Flow Index (MFI) combines price and volume to calculate “money flow,” revealing when capital is moving into or out of a security.
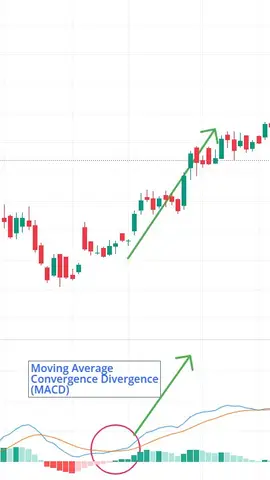
MACD Indicator
Moving Average Convergence Divergence (MACD) compares a fast and a slow exponential moving average to visualise momentum and trend shifts.
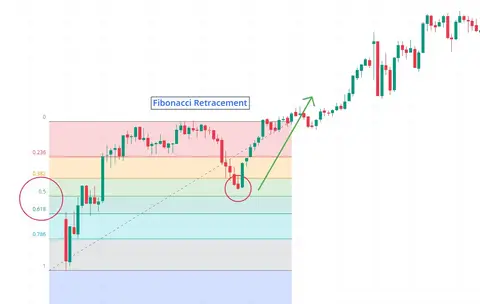
Fibonacci Retracement
Plots horizontal lines at key Fibonacci percentages of a prior move to flag potential pause or reversal zones.
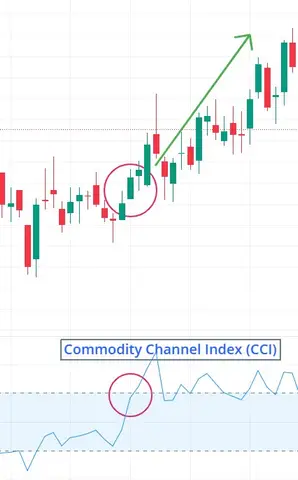
Commodity Channel Index (CCI)
Commodity Channel Index (CCI) is a momentum oscillator that gauges how far the current price deviates from its recent average.
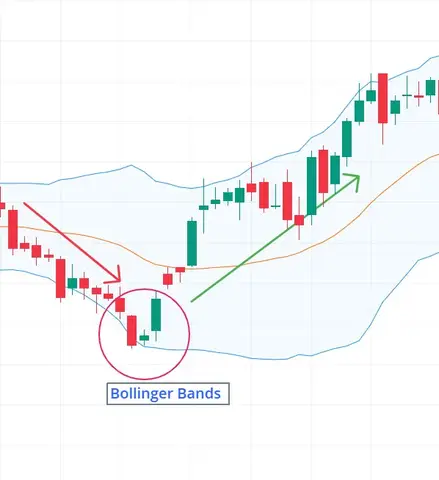
Bollinger Bands
Bollinger Bands plot a moving average (middle band) and two volatility envelopes (upper & lower bands) to show when prices are relatively high or low versus recent history.