
Indicator
Relative Strength Index (RSI) रिलेटिव स्ट्रेंथ इंडेक्स (RSI)
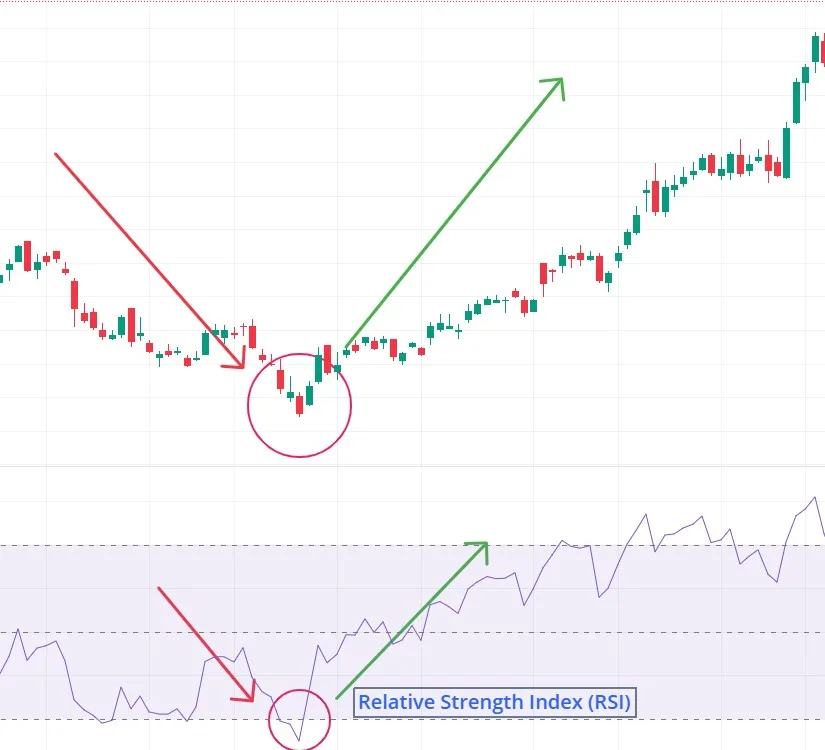
Relative Strength Index (RSI) quantifies the speed and magnitude of recent price changes to gauge momentum. Relative Strength Index (RSI) हालिया प्राइस मूव के वेग और आकार को मापकर मोमेंटम बताता है।
Indicator Overview
What RSI Measures
- Relative Strength Index (RSI) quantifies the speed and magnitude of recent price changes to gauge momentum.
- Outputs a value between 0 – 100 to show overbought/oversold zones.
How It Is Calculated
Step-by-Step (14-period default)
- Average Gain = sum of gains ÷ 14.
- Average Loss = sum of losses ÷ 14.
- RS = Average Gain ÷ Average Loss.
- RSI = 100 − [100 / (1 + RS)].
- Example: Avg Gain 1.5, Avg Loss 0.5 ⇒ RS = 3 ⇒ RSI ≈ 75.
Interpreting RSI
Key Levels & Signals
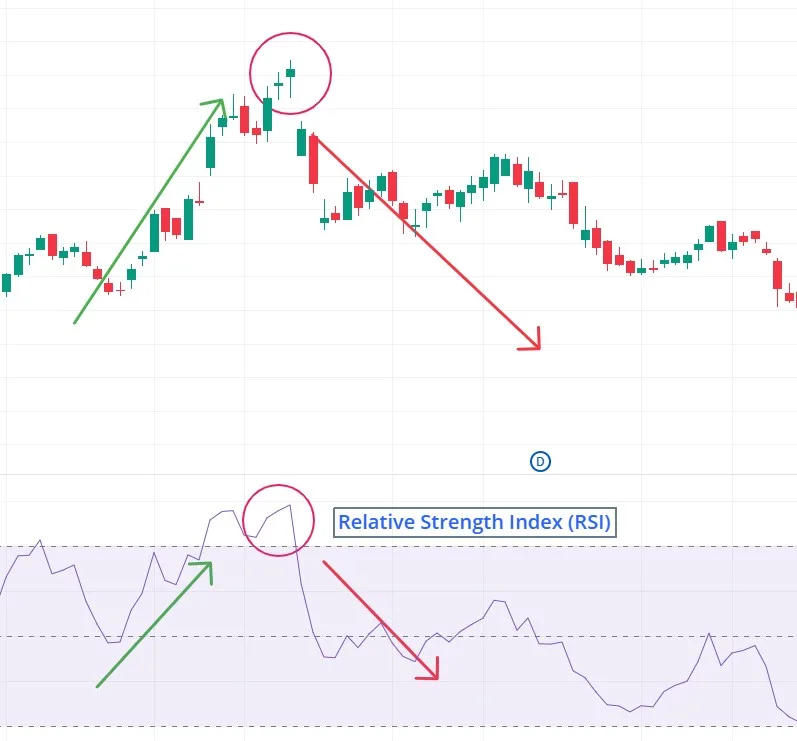
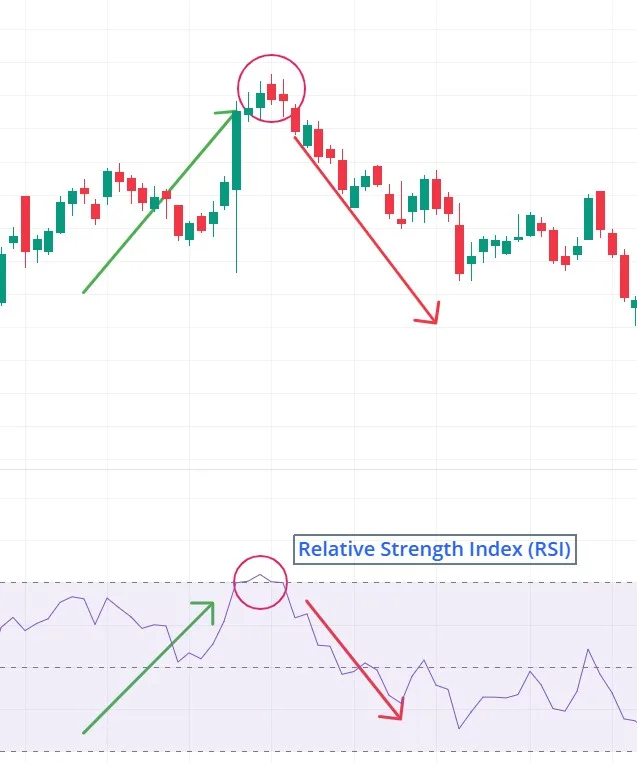
- RSI > 70 → overbought / strong upward momentum.
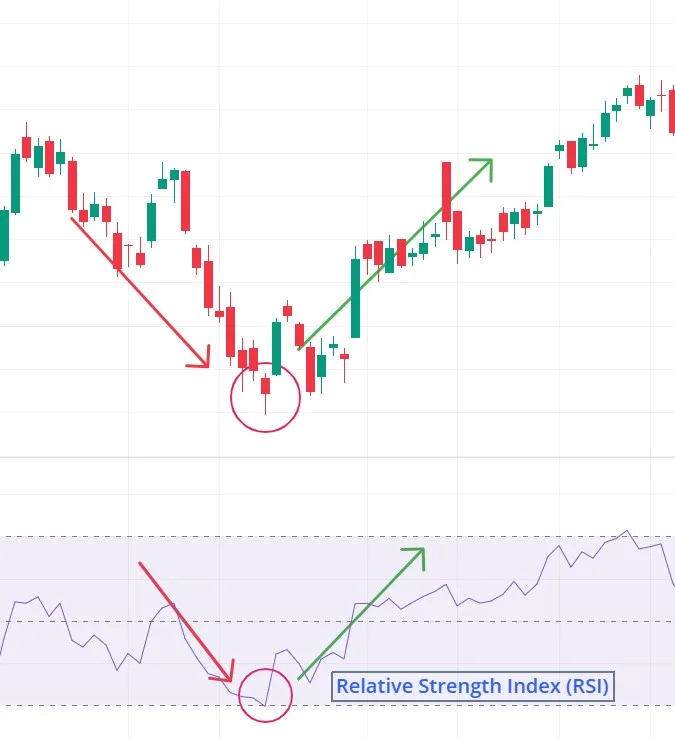
- RSI < 30 → oversold / strong downward momentum.
- 30 – 70 zone → neutral / balanced range.
- Price–RSI divergence → potential trend change.
Strengths & Limitations
Strengths
- Easy to visualise momentum extremes.
- Fixed 0-100 scale—beginner-friendly.
- Period adjustable for any timeframe.
Limitations
- Lagging—uses past data; slow on sudden moves.
- Can stay >70 or <30 during strong trends.
- Needs confirmation from other tools.
Example Scenario
Typical Reading
- RSI climbs to 80 after steady rise → price overextended upward.
- RSI dips to 20 after sell-off → oversold, watch for bounce.
Practical Tips
Best Practices
- Combine with trend MA to trade only in trend direction.
- Use divergence plus candlestick patterns for reversal entries.
- Shorten period (e.g., 7) for faster signals; lengthen (e.g., 21) for smoother.
Quiz: Trader Knowledge Check
True or False
- RSI values above 70 always guarantee an immediate price reversal.
- (Answer: False – RSI can remain extreme in strong trends.)
इंडिकेटर अवलोकन
RSI क्या मापता है
- Relative Strength Index (RSI) हालिया प्राइस मूव के वेग और आकार को मापकर मोमेंटम बताता है।
- 0 – 100 के बीच वैल्यू देता है ताकि ओवरबॉट/ओवरसोल्ड पहचान सकें।
कैसे गणना होती है
स्टेप-बाय-स्टेप (डिफ़ॉल्ट 14)
- Average Gain = गेन का योग ÷ 14.
- Average Loss = लॉस का योग ÷ 14.
- RS = Average Gain ÷ Average Loss.
- RSI = 100 − [100 / (1 + RS)].
- उदाहरण: Avg Gain 1.5, Avg Loss 0.5 ⇒ RS = 3 ⇒ RSI ≈ 75.
RSI कैसे पढ़ें
मुख्य स्तर व सिग्नल
70 → ओवरबॉट / तेज़ ऊपर की गति.
- < 30 → ओवरसोल्ड / तेज़ गिरावट.
- 30 – 70 → सामान्य रेंज.
- प्राइस-RSI डाइवर्जेंस → ट्रेंड बदल सकता है.
फायदे व कमियाँ
Strengths (फायदे)
- मोमेंटम एक्स्ट्रीम जल्दी पहचानता.
- 0-100 स्केल—समझना आसान.
- पीरियड बदलकर किसी भी टाइमफ्रेम पर इस्तेमाल.
Limitations (कमज़ोरियाँ)
- लेगिंग—पुराने डेटा पर आधारित.
- मज़बूत ट्रेंड में लंबे समय तक चरम पर रह सकता है.
- अन्य इंडिकेटर से पुष्टि ज़रूरी.
उदाहरण
टिपिकल रीडिंग
- लगातार तेजी के बाद RSI 80 → कीमत तेज़ी से ऊपर, ओवरबॉट.
- तेज़ गिरावट के बाद RSI 20 → ओवरसोल्ड, बाउंस संभव.
प्रैक्टिकल टिप्स
सर्वोत्तम अभ्यास
- ट्रेंड MA के साथ उपयोग करें ताकि ट्रेंड दिशा में ही ट्रेड करें.
- डाइवर्जेंस + कैंडलस्टिक पैटर्न से रिवर्सल एंट्री लें.
- पीरियड छोटा (7) → तेज़ सिग्नल, बड़ा (21) → स्मूद सिग्नल.
क्विज़
सही या गलत
- 70 से ऊपर RSI का मतलब कीमत तुरंत उलटेगी।
- (उत्तर: गलत – स्ट्रॉन्ग ट्रेंड में RSI लंबे समय तक ऊँचा रह सकता है.)