
Indicator
Money Flow Index (MFI) मनी फ्लो इंडेक्स (MFI)
Money Flow Index (MFI) combines price and volume to calculate “money flow,” revealing when capital is moving into or out of a security. Money Flow Index (MFI) कीमत और वॉल्यूम दोनों को जोड़कर मनी फ्लो दिखाता है—कितना पैसा एसेट में आ/जा रहा है।
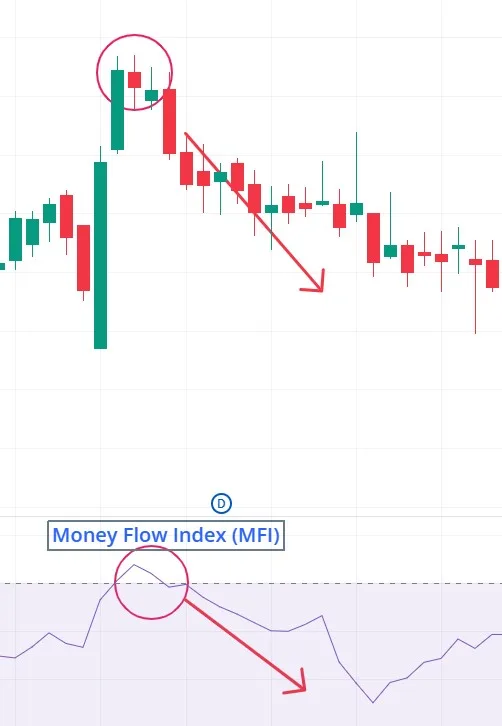
Indicator Overview
What the MFI Measures
- Money Flow Index (MFI) combines price and volume to calculate “money flow,” revealing when capital is moving into or out of a security.
- Highlights overbought (>80) or oversold (<20) conditions and can warn of momentum shifts via divergence.
How It Is Calculated
Step-by-Step
- Typical Price = (High + Low + Close) / 3.
- Raw Money Flow = Typical Price × Volume.
- Positive MF if Typical > previous; Negative if lower.
- Sum positives & negatives over 14 periods (default).
- Money Flow Ratio = PosMF / NegMF.
- MFI = 100 − [100 / (1 + Ratio)].
Interpreting Signals
Key Levels
- MFI > 80 → overbought, possible pullback.
- MFI < 20 → oversold, potential rebound.
- 20–80 zone → neutral/normal flow.
- Price–MFI divergence → trend weakening alert.
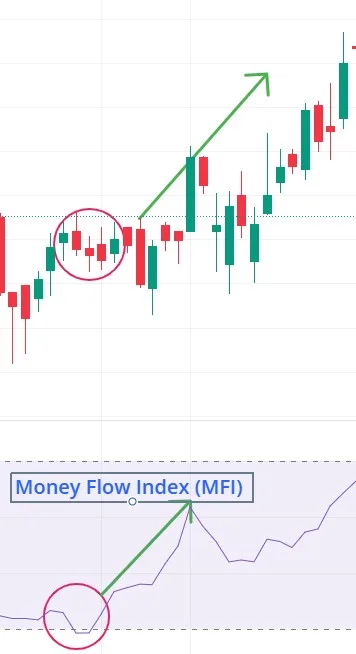
Strengths & Limitations
Strengths
- Incorporates volume—richer than price-only oscillators.
- Spots overbought/oversold extremes clearly.
- Divergence gives early reversal clues.
Limitations
- Lagging—reacts to past data.
- Can remain >80 or <20 in strong trends.
- Needs other indicators for confirmation.
Example Scenario
Sample Reading
- MFI rises >80 with price surge → watch for pullback.
- MFI falls <20 during sell-off → oversold, monitor for bounce.
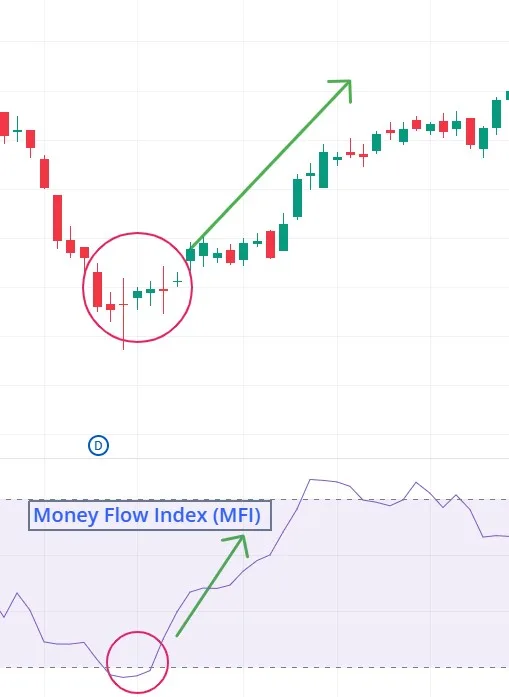
Practical Tips
Best Practices
- Use with trend filters (moving averages).
- Combine with RSI/MACD for momentum confirmation.
- Look for MFI divergence at key support/resistance.
Quiz: Trader Knowledge Check
True or False
- An MFI reading above 80 always means price will immediately reverse downward.
- (Answer: False – extremes can persist in strong trends.)
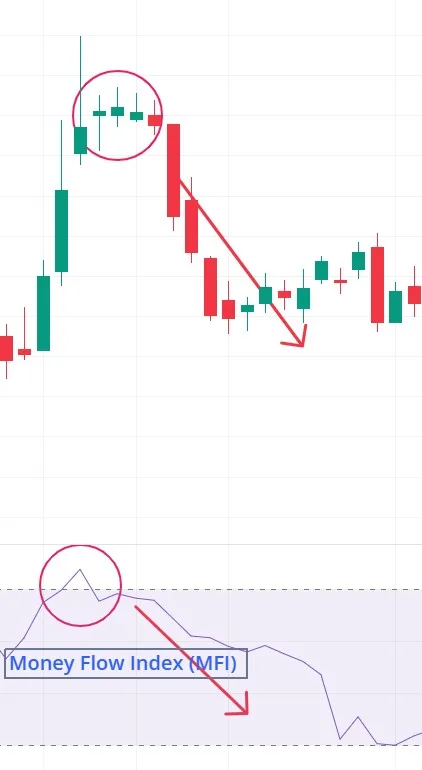
इंडिकेटर अवलोकन
MFI क्या मापता है
- Money Flow Index (MFI) कीमत और वॉल्यूम दोनों को जोड़कर मनी फ्लो दिखाता है—कितना पैसा एसेट में आ/जा रहा है।
80 पर ओवरबॉट और <20 पर ओवरसोल्ड स्थितियाँ दर्शाता है; डाइवर्जेंस से ट्रेंड कमजोर पड़ने की चेतावनी देता है।
कैसे गणना होती है
स्टेप-बाय-स्टेप
- टिपिकल प्राइस = (High + Low + Close) / 3.
- Raw Money Flow = Typical × Volume.
- Typical↑ → Positive MF, Typical↓ → Negative MF.
- 14 पीरियड में पॉज़िटिव व नेगेटिव जोड़ें।
- Ratio = Pos / Neg.
- MFI = 100 − [100 / (1 + Ratio)].
सिग्नल कैसे समझें
मुख्य स्तर
80 → ओवरबॉट, गिरावट की संभावना।
- <20 → ओवरसोल्ड, उछाल संभव।
- 20–80 → सामान्य ज़ोन।
- प्राइस–MFI डाइवर्जेंस → ट्रेंड कमज़ोर पड़ सकता है।
फायदे व कमियाँ
Strengths (फायदे)
- वॉल्यूम शामिल करता है, सिर्फ कीमत से बेहतर।
- ओवरबॉट/ओवरसोल्ड जल्दी दिखाता है।
- डाइवर्जेंस से शुरुआती रिवर्सल संकेत मिलते हैं।
Limitations (कमज़ोरियाँ)
- लेगिंग—पुराने डेटा पर आधारित।
- मज़बूत ट्रेंड में लंबे समय तक चरम पर रह सकता है।
- अन्य टूल्स के साथ उपयोग ज़रूरी।
उदाहरण
टिपिकल रीडिंग
80 पर MFI व प्राइस तेज़ी → पुलबैक संभव।
- <20 पर MFI व गिरावट → ओवरसोल्ड, उछाल देखना।
प्रैक्टिकल टिप्स
सर्वोत्तम अभ्यास
- ट्रेंड फ़िल्टर (MA) के साथ उपयोग करें।
- मोमेंटम पुष्टि के लिए RSI/MACD जोड़ें।
- मुख्य सपोर्ट/रेज़िस्टेंस पर MFI डाइवर्जेंस देखें।
क्विज़
True or False
- सही या गलत: 80 से ऊपर MFI मतलब कीमत तुरंत नीचे पलटेगी।
- (उत्तर: गलत – स्ट्रॉन्ग ट्रेंड में ये स्तर बने रह सकते हैं।)