
Indicator
Fibonacci Retracement फिबोनाच्ची रिट्रेसमेंट
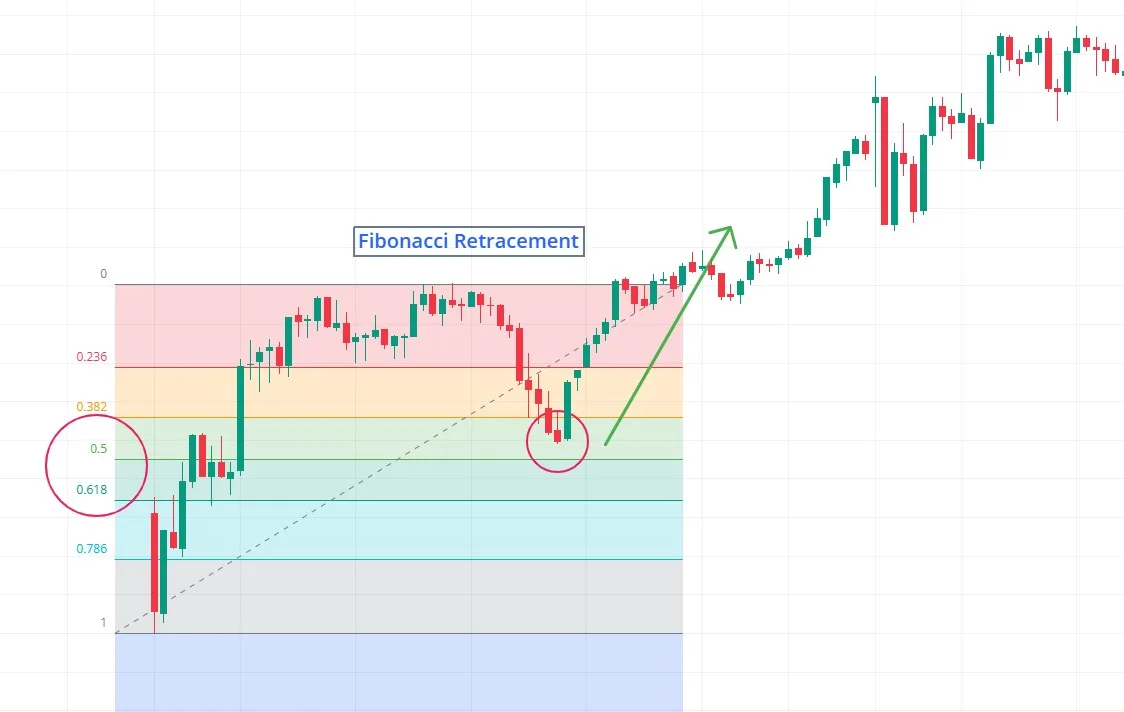
Plots horizontal lines at key Fibonacci percentages of a prior move to flag potential pause or reversal zones. पिछले मूव के फ़िबोनैचि प्रतिशत पर क्षैतिज रेखाएँ बनाकर संभावित सपोर्ट/रेज़िस्टेंस ज़ोन दिखाता है।
Indicator Overview
What Fibonacci Retracement Measures
- Plots horizontal lines at key Fibonacci percentages of a prior move to flag potential pause or reversal zones.
- Shows how far price has retraced relative to its recent swing.
How It Is Calculated
Step-by-Step
- Pick a significant High and Low on chart.
- Total move = High − Low.
- Common ratios: 23.6 %, 38.2 %, 50 %, 61.8 %, 78.6 %.
- Down retrace: High − (Total × ratio). Up retrace: Low + (Total × ratio).
How to Interpret Levels
Key Insights
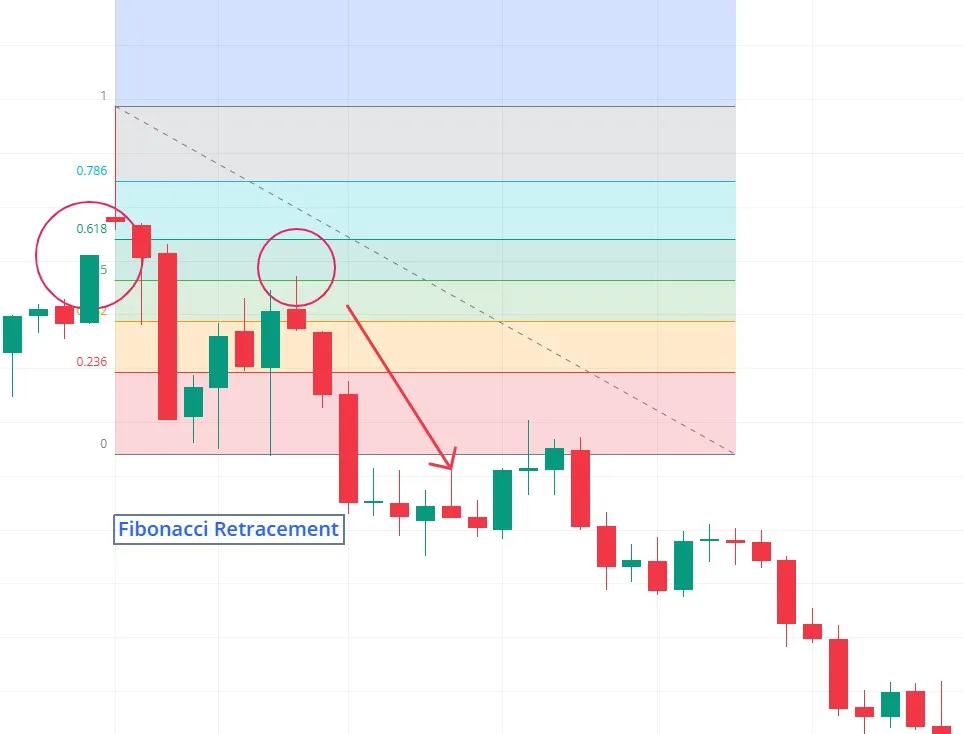
- Price often stalls or pivots near 38.2 % or 61.8 %.
- Multiple Fibonacci confluences strengthen a zone.
- Levels are potential, not guaranteed turning points.
Strengths & Limitations
Strengths
- Widely watched—can become self-reinforcing.
- Simple: only need High & Low.
- Works on any timeframe / asset.
Limitations
- Descriptive, not predictive of direction/timing.
- Subjective high/low selection → different levels.
- Needs other tools for confirmation.
Example Calculation
Sample Move
- Move: 100 → 200 (distance 100).
- 38.2 % retrace = 100 × 0.382 = 38.2.
- Level = 200 − 38.2 = 161.8.
Practical Tips
Best Practices
- Combine with RSI/MACD to gauge momentum at Fib levels.
- Watch for candlestick confirmation (pin bars, engulfing).
- Use multiple swing highs/lows for confluence zones.
Quiz: Trader Knowledge Check
True or False
- Fibonacci Retracement levels forecast when a price move will reverse.
- (Answer: False – they highlight possible zones, not timing/direction.)
इंडिकेटर अवलोकन
Fibonacci Retracement क्या मापता है
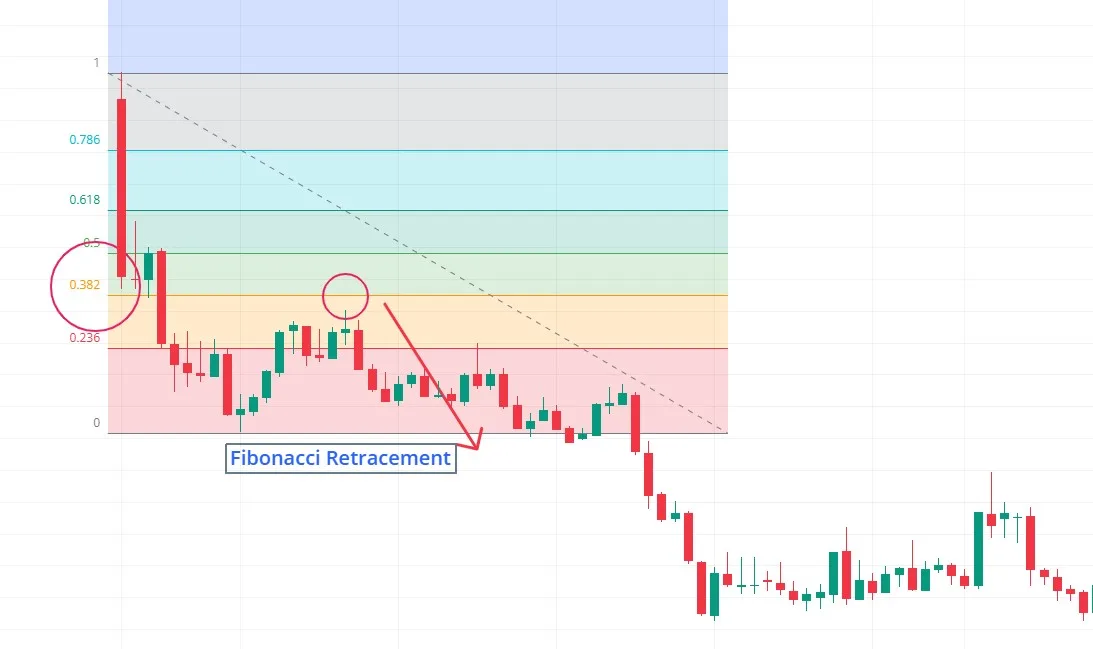
- पिछले मूव के फ़िबोनैचि प्रतिशत पर क्षैतिज रेखाएँ बनाकर संभावित सपोर्ट/रेज़िस्टेंस ज़ोन दिखाता है।
- बताता है कि कीमत हालिया स्विंग का कितना हिस्सा वापस आई है।
कैसे गणना होती है
स्टेप-बाई-स्टेप
- चार्ट पर स्पष्ट हाई व लो चुनें।
- कुल मूव = High − Low.
- प्रचलित रेश्यो: 23.6, 38.2, 50, 61.8, 78.6 %.
- डाउन रिट्रेस: High − (कुल × रेश्यो) | अप रिट्रेस: Low + (कुल × रेश्यो)
लेवल कैसे पढ़ें
मुख्य संकेत
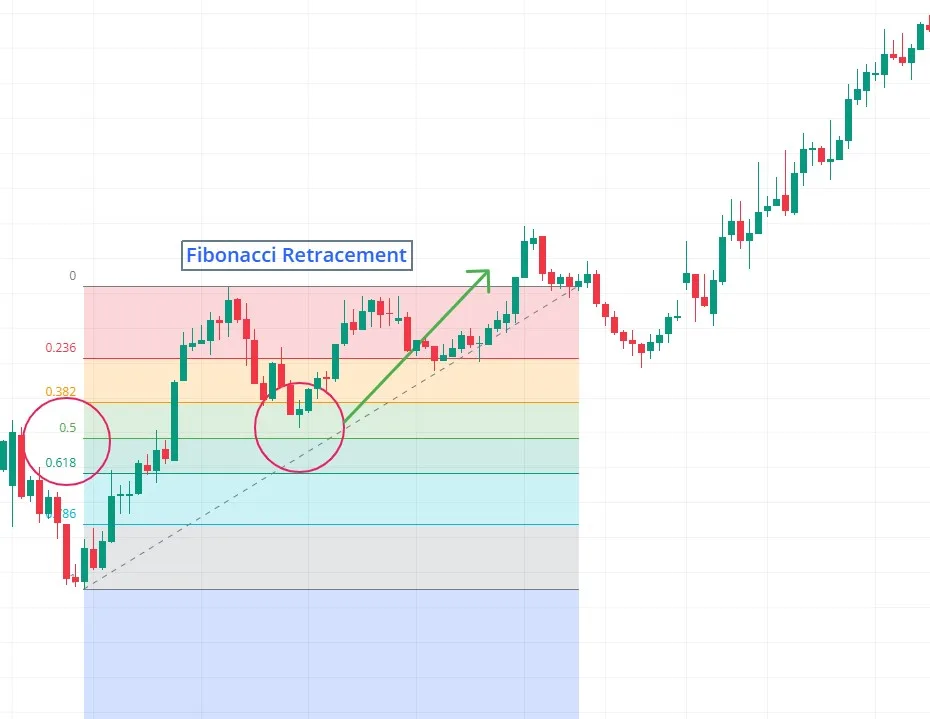
- कीमत अक्सर 38.2 % या 61.8 % के पास रुकती/पलटती।
- कई फ़िब स्तर एक साथ हों तो ज़ोन मज़बूत होता है।
- ये संभावित ज़ोन हैं, पक्का टर्निंग पॉइंट नहीं।
फायदे व कमज़ोरियाँ
Strengths (फायदे)
- व्यापक रूप से उपयोग—सेल्फ-फुलफिलिंग हो सकता है।
- सरल: सिर्फ हाई व लो चाहिए।
- सभी टाइमफ्रेम/एसेट पर काम करता।
Limitations (कमियाँ)
- दिशा/टाइमिंग नहीं बताता, सिर्फ ज़ोन दिखाता।
- हाई/लो चयन सब्जेक्टिव—लेवल बदल सकते हैं।
- पुष्टि के लिए अन्य इंडिकेटर जरूरी।
उदाहरण गणना
उदाहरण
- मूव: 100 → 200 (दूरी 100).
- 38.2 % रिट्रेस = 100 × 0.382 = 38.2.
- लेवल = 200 − 38.2 = 161.8.
प्रैक्टिकल टिप्स
सर्वोत्तम अभ्यास
- Fib लेवल पर RSI/MACD से मोमेंटम जांचें।
- कैंडलस्टिक पुष्टि (पिनबार, एंगल्फिंग) देखें।
- कई स्विंग हाई/लो से कन्फ्लुएंस ज़ोन बनाएं।
क्विज़
True or False
- सही या गलत: फ़िबोनैचि रिट्रेसमेंट यह भविष्यवाणी करता है कि कीमत कब पलटेगी।
- (उत्तर: गलत – यह सिर्फ संभावित ज़ोन दिखाता है, समय नहीं।)