
Chart Pattern
Bullish Rectangle बुलिश रेक्टैंगल
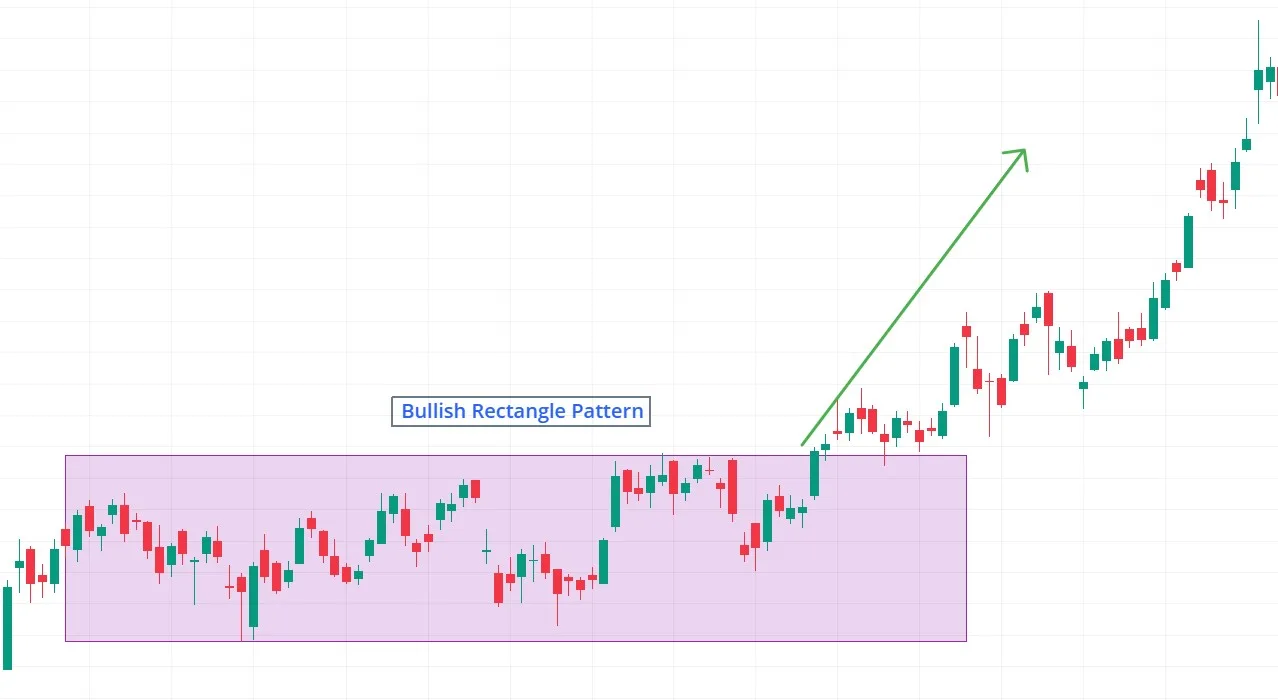
Bullish Rectangle = sideways consolidation within an uptrend; breakout signals trend resumption higher. बुलिश रेक्टेंगल = अपट्रेंड के बीच साइडवेज़ कंसॉलिडेशन; ब्रेकआउट पर तेजी जारी रहती है।
Pattern Overview
Definition & Classification
- Bullish Rectangle = sideways consolidation within an uptrend; breakout signals trend resumption higher.
- Type: Bullish continuation pattern.
- Reliability: Moderately reliable when volume backs the breakout.
Formation & Structure
Visual Traits
- Parallel horizontal support & resistance lines.
- Price oscillates between boundaries (≥2 touches each).
- Volume contracts during rectangle; spikes on breakout.
- Candles: mixed bullish / bearish, small-medium bodies.
Strict Identification Criteria
- Preceded by clear uptrend.
- ≥2 touches on both support & resistance.
- Breakout with above-average volume confirms pattern.
Psychological Interpretation
- Buyers & sellers reach balance → sideways drift; breakout shows buyers regain control.
- Fear / Greed Dynamics:
- Bulls accumulate near support.
- Bears short near resistance, but fail.
- Breakout forces short covering (FOMO).
Real-World Example
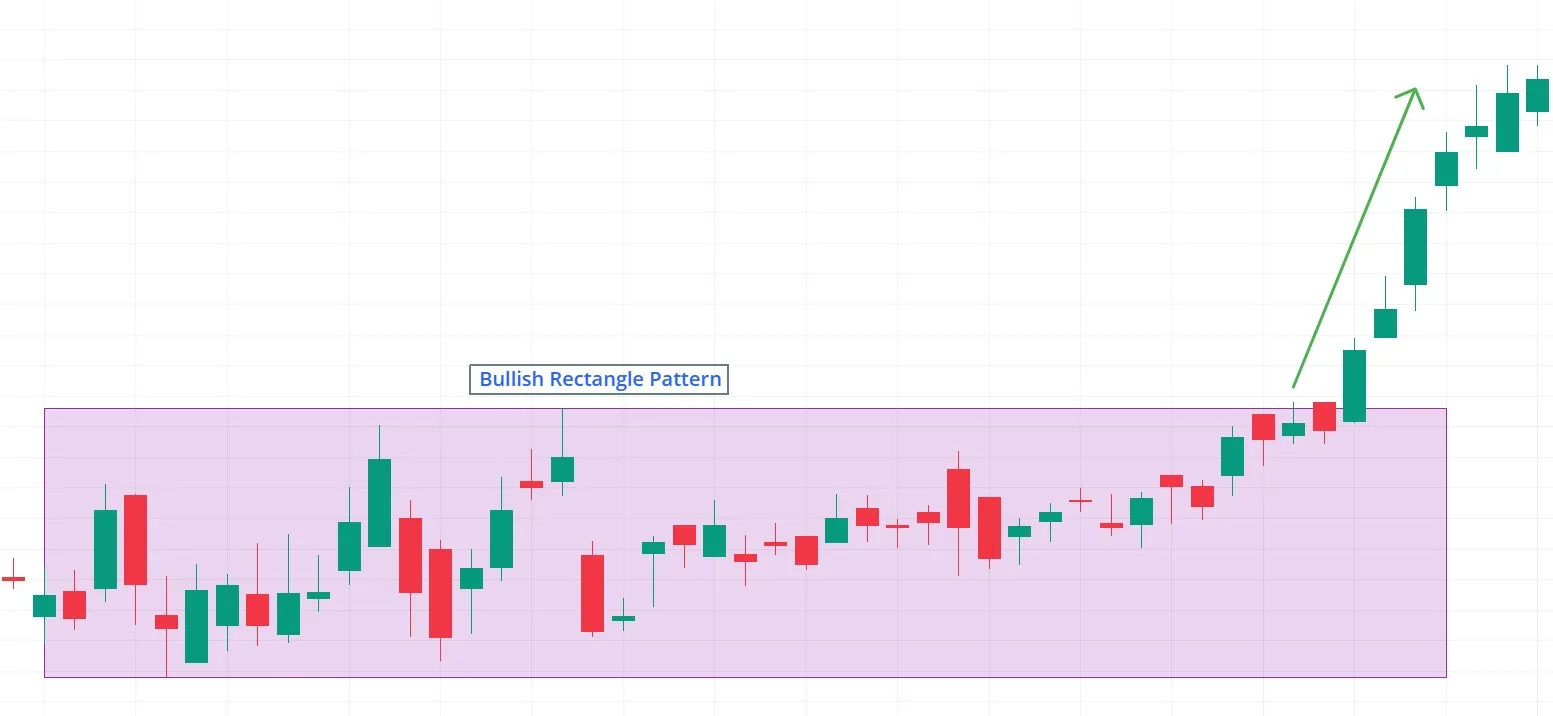
- XYZ consolidates $100–110 after uptrend.
- Breakout above $110 with volume surge → price rallies to $130 (rectangle height added).
Strategic Insights
Entry & Confirmation
- Enter on close above resistance + strong volume.
- Secondary signals: RSI > 50, MACD bullish, MAs aligned upward.
Trigger & Exit Targets
- Trigger: Breakout candle close or retest entry.
- Targets:
- Measured move → add rectangle height to breakout.
- 161.8 % Fibonacci extension.
Risk Management
- Risk 1–2 % capital per trade.
- Stop-loss below rectangle support / recent swing low.
- Pro Tip: Retest of breakout level gives safer entry (reduces false breaks).
Common Pitfalls & Cautions
Frequent Issues
- False breakout without volume.
- Trading rectangles in range-bound markets (no trend).
- Ignoring trend context → misclassifying pattern.
Variations & Similar Patterns
Comparable Patterns
- Bullish Flag – downward-sloping consolidation.
- Symmetrical Triangle – converging lines.
- Rectangles = clear horizontal boundaries.
Quiz: Trader Knowledge Check
True or False
- A bullish rectangle is confirmed only when volume supports the breakout above resistance.
- (Answer: True – volume is key for validation.)
पैटर्न ओवरव्यू
परिभाषा व वर्गीकरण
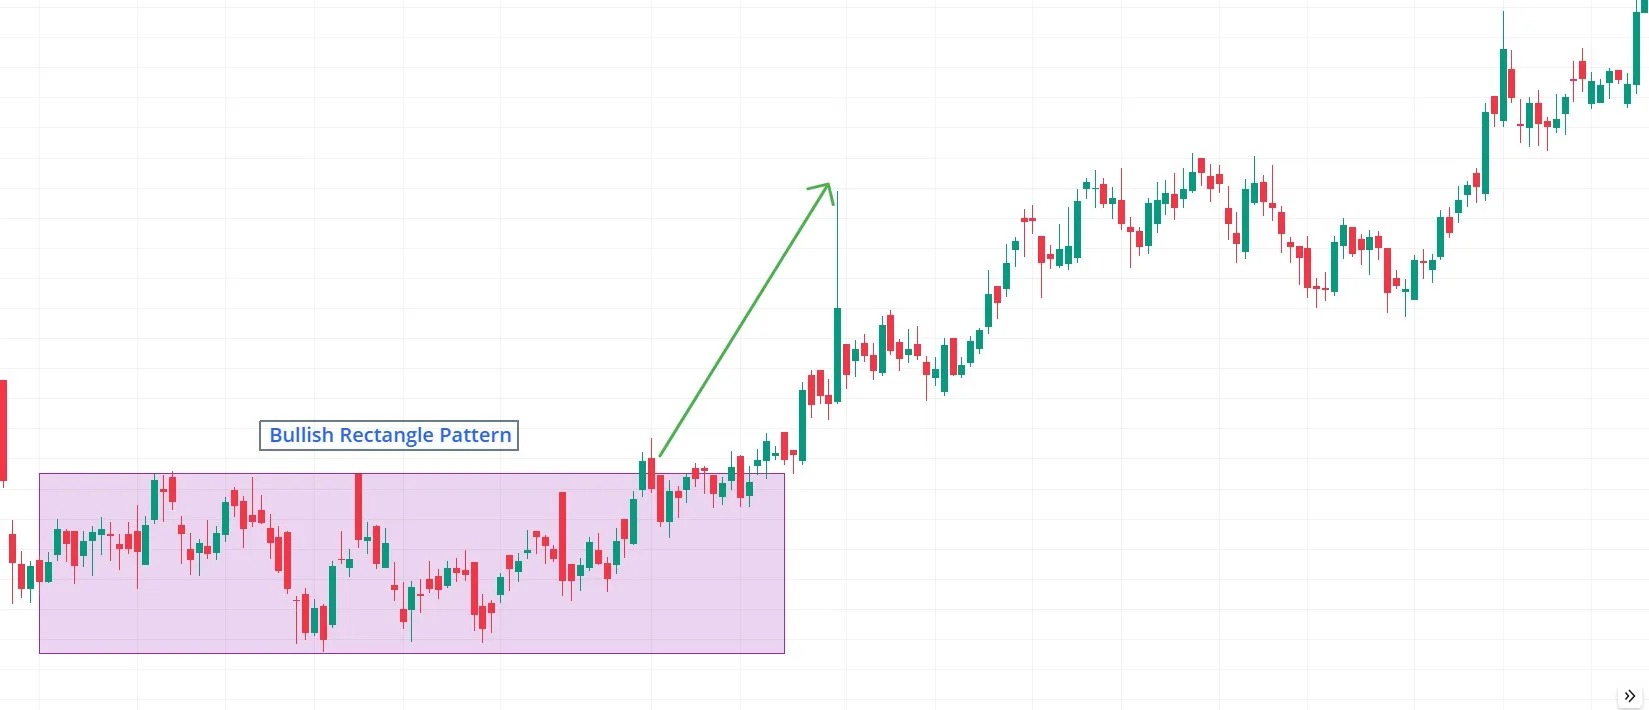
- बुलिश रेक्टेंगल = अपट्रेंड के बीच साइडवेज़ कंसॉलिडेशन; ब्रेकआउट पर तेजी जारी रहती है।
- प्रकार: बुलिश कंटिन्यूएशन पैटर्न।
- विश्वसनीयता: वॉल्यूम पुष्टि के साथ मध्यम-उच्च।
गठन और संरचना
दृश्य विशेषताएँ
- समानांतर क्षैतिज सपोर्ट-रेजिस्टेंस; कम से कम दो-दो टच।
- कीमत सीमाओं के बीच ऊपर-नीचे होती है।
- कंसॉलिडेशन में वॉल्यूम घटता, ब्रेकआउट पर बढ़ता है।
- कैंडल्स: मिश्रित रंग, छोटी-मध्यम बॉडी।
सख्त पहचान मानदंड
- पहले स्पष्ट अपट्रेंड।
- सपोर्ट-रेजिस्टेंस पर दो-दो टच अनिवार्य।
- ब्रेकआउट पर उच्च वॉल्यूम पुष्टि करता है।
मनोवैज्ञानिक व्याख्या
- खरीदार-विक्रेता संतुलन में → साइडवेज़ मूव; ब्रेकआउट पर खरीदार मजबूत।
- डर-लालच:
- सपोर्ट पर बुल्स खरीदते हैं।
- रेजिस्टेंस पर बेयर्स शॉर्ट करते हैं।
- ब्रेकआउट पर शॉर्ट कवरिंग शुरू।
वास्तविक उदाहरण
- XYZ $100–110 में समेकित होता है।
- $110 के ऊपर वॉल्यूम स्पाइक के साथ ब्रेकआउट → लक्ष्य $130।
रणनीतिक सुझाव
एंट्री और पुष्टि
- रेजिस्टेंस के ऊपर क्लोज व उच्च वॉल्यूम पर एंट्री।
- RSI > 50, MACD पॉज़िटिव, MA ऊपर।
ट्रिगर व लक्ष्य
- ट्रिगर: ब्रेकआउट क्लोज / रीटेस्ट पर एंट्री।
- लक्ष्य:
- रेक्टेंगल ऊँचाई जोड़ें।
- 161.8 % फिबोनाची एक्सटेंशन।
रिस्क प्रबंधन
- प्रति ट्रेड 1–2 % पूंजी जोखिम।
- स्टॉप-लॉस: सपोर्ट या स्विंग लो के नीचे।
- प्रो टिप: रीटेस्ट पर एंट्री अधिक सुरक्षित।
सामान्य गलतियाँ
आम समस्याएँ
- कम वॉल्यूम पर झूठा ब्रेकआउट।
- रेंज मार्केट में रेक्टेंगल ट्रेड करने से बचें।
- ट्रेंड संदर्भ अनदेखा करने से भ्रम।
विविधताएँ व समान पैटर्न
तुलनीय पैटर्न
- बुलिश फ्लैग – नीचे झुकती कंसॉलिडेशन।
- सिमेट्रिकल ट्रायंगल – अभिसरण लाइन्स।
- रेक्टेंगल = स्पष्ट क्षैतिज सीमाएँ।
क्विज़: व्यापारी ज्ञान परीक्षण
True or False
- सही या गलत: बुलिश रेक्टेंगल तभी वैध है जब ब्रेकआउट पर वॉल्यूम बढ़े।
- (उत्तर: सही – वॉल्यूम आवश्यक है)।