
Candlestick Pattern
Bullish
Unique Three River Bottom यूनिक थ्री रिवर बॉटम
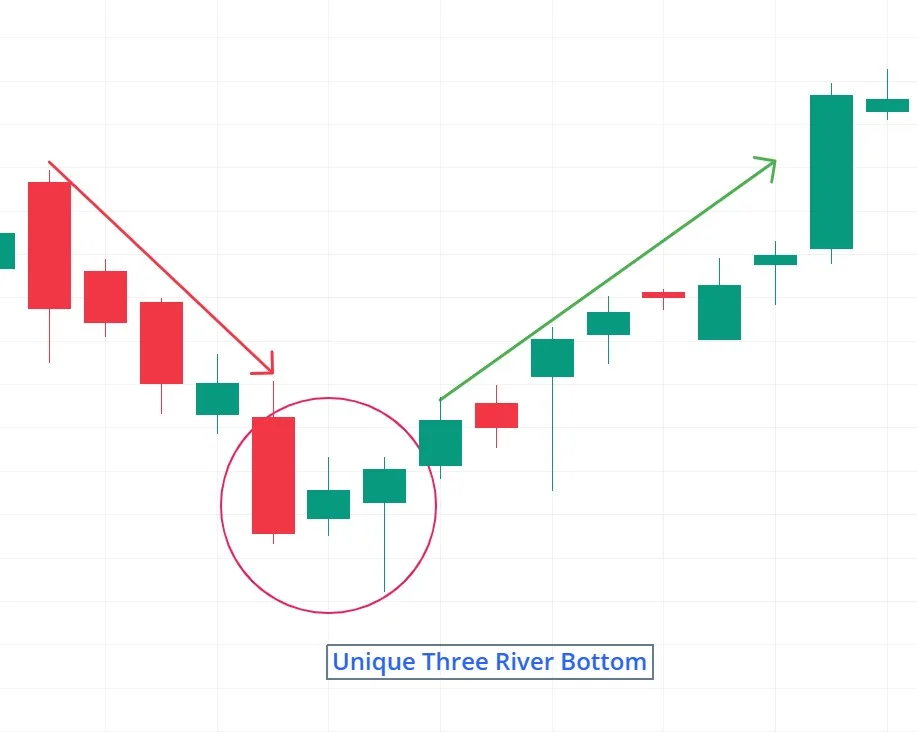
A bullish reversal pattern appearing after a downtrend, signaling potential exhaustion of sellers. यह एक बुलिश रिवर्सल पैटर्न है जो डाउनट्रेंड के अंत में दिखाई देता है, जो बेचने वालों की कमजोरी को दर्शाता है।
Pattern Overview
Definition & Type
- A bullish reversal pattern appearing after a downtrend, signaling potential exhaustion of sellers.
- Composed of three candles, with the third candle forming a hammer-like structure.
Reliability
- Considered a moderate-to-strong reversal signal when confirmed.
- More reliable near key support levels or in oversold market conditions.
Formation & Structure
Formation
- Number of Candles: 3
- Visual Description:
- First Candle: A long bearish candle.
- Second Candle: Another bearish candle with a smaller body showing weakening momentum.
- Third Candle: A bullish hammer or doji with a small body and long lower wick.
- Key Identification Criteria:
- Third candle must have a small real body (bullish or doji) and a long lower wick.
- First two candles should be consecutive bearish candles with decreasing momentum.
Psychological Interpretation
- Market Sentiment:
- Initial strong selling (first candle).
- Selling pressure weakens (second candle).
- Buyers step in, rejecting lower prices (third candle).
- Behavior of Buyers/Sellers:
- Bears lose control as the downtrend slows.
- Bulls defend a price level, indicating a potential trend reversal.
Example with Analysis
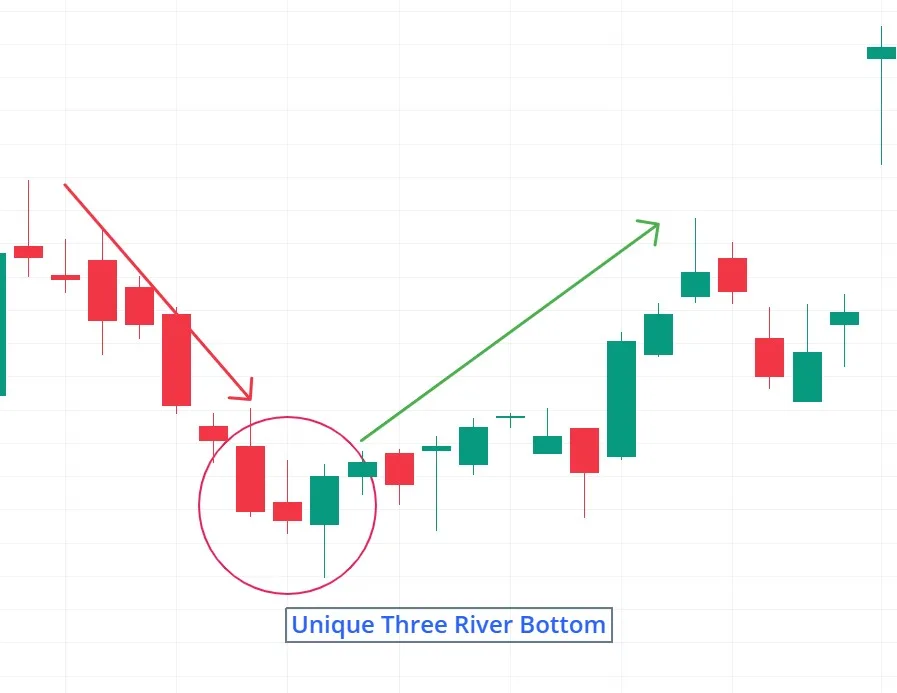
- Example (xyz company – Daily Chart):
- Setup: After a 5-day decline, the pattern forms near a major support at $145.
- Confirmation: Next candle breaks above the second candle’s high with rising volume.
- Price Behavior: Stock rallies 6 % over the next three sessions.
Strategic Insights (As Shared by Traders)
Entry & Confirmation
- Traders usually wait for a close above the second candle’s high before entering.
- Many look for increased buying volume to confirm strength.
Trigger Point & Exit Point Targets
- Common Trigger Point placed below the third candle’s low.
- Exit targets set at 1.5× to 2× the pattern’s height.
Risk Management
- Experienced traders risk no more than 1–2 % of capital per trade.
- Experts recommend combining with RSI or MACD divergence for higher accuracy.
Pro Tips
- Works best with confluence: Fibonacci retracements or moving-average support reinforce reliability.
- Higher timeframes carry more weight: Daily/weekly charts are more significant than lower timeframes.
Common Pitfalls & Cautions
Misinterpretations
- New traders sometimes confuse it with a regular three-candle pullback without a hammer confirmation.
- Acting prematurely before the third candle fully forms.
Avoiding Mistakes
- Seasoned traders avoid entries without volume confirmation.
- Experts recommend waiting for a close above resistance rather than intraday breaks.
Variations & Similar Patterns
Similar Patterns
- Morning Star – Stronger three-candle bullish reversal with a gap.
- Tweezer Bottom – Two-candle pattern with matching lows.
- Bullish Engulfing – Two-candle reversal where the second candle engulfs the first.
Quiz: Test Your Knowledge
True or False
- The Unique Three River Bottom pattern is considered complete only if the third candle is a doji or hammer with a long lower wick.
- (Answer: True – The third candle must show clear rejection of lower prices.)
पैटर्न ओवरव्यू
परिभाषा और प्रकार
- यह एक बुलिश रिवर्सल पैटर्न है जो डाउनट्रेंड के अंत में दिखाई देता है, जो बेचने वालों की कमजोरी को दर्शाता है।
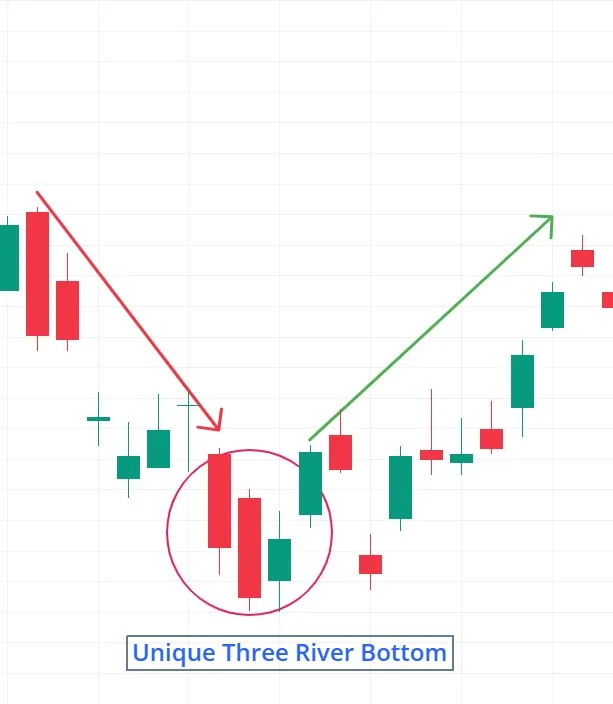
- इसमें तीन कैंडल्स होती हैं, जिसमें तीसरी कैंडल हैमर या डोजी की तरह बनती है।
विश्वसनीयता
- कन्फर्मेशन मिलने पर यह मध्यम से मजबूत रिवर्सल सिग्नल देता है।
- सपोर्ट लेवल या ओवरसोल्ड कंडीशन में ज्यादा भरोसेमंद होता है।
गठन और संरचना
गठन
- कैंडल्स की संख्या: 3
- दिखावट:
- पहली कैंडल: लंबी बेयरिश कैंडल।
- दूसरी कैंडल: एक और बेयरिश कैंडल लेकिन छोटे बॉडी के साथ, जो कमजोर मोमेंटम दिखाती है।
- तीसरी कैंडल: एक बुलिश हैमर या डोजी जिसमें छोटा बॉडी और लंबी लोअर विक होती है।
- पहचान के मुख्य नियम:
- तीसरी कैंडल का बॉडी छोटा और लोअर विक लंबी होनी चाहिए।
- पहली दो कैंडल्स लगातार बेयरिश होनी चाहिए और मोमेंटम घटता हुआ दिखना चाहिए।
मनोवैज्ञानिक व्याख्या
- मार्केट सेंटीमेंट:
- पहली कैंडल में तेज बिकवाली।
- दूसरी कैंडल में बिकवाली कमजोर पड़ती है।
- तीसरी कैंडल में खरीदार निचले प्राइस को रिजेक्ट करते हैं।
- खरीदार/विक्रेता व्यवहार:
- बेयर कंट्रोल खो देते हैं क्योंकि डाउनट्रेंड धीमा होता है।
- बुल्स सपोर्ट लेवल पर खरीदारी करते हैं, रिवर्सल का संकेत।
उदाहरण और विश्लेषण
- उदाहरण (xyz company – डेली चार्ट):
- सेटअप: 5 दिन की गिरावट के बाद $145 के सपोर्ट पर यह पैटर्न बनता है।
- कन्फर्मेशन: अगली कैंडल दूसरी कैंडल के हाई को तोड़ती है और वॉल्यूम बढ़ता है।
- प्राइस मूवमेंट: अगले 3 दिनों में स्टॉक 6 % ऊपर जाता है।
स्ट्रेटेजिक इनसाइट्स (ट्रेडर्स के अनुभव से)
एंट्री और कन्फर्मेशन
- ट्रेडर्स आमतौर पर दूसरी कैंडल के हाई के ऊपर क्लोज का इंतजार करते हैं।
- कई लोग पुष्टि के लिए वॉल्यूम बढ़ने का इंतजार करते हैं।
Trigger Point और लक्ष्य
- Trigger Point तीसरी कैंडल के लो से नीचे लगाया जाता है।
- लाभ लक्ष्य आमतौर पर पैटर्न की ऊंचाई के 1.5× से 2× पर सेट होते हैं।
रिस्क मैनेजमेंट
- अनुभवी ट्रेडर्स प्रति ट्रेड 1–2 % से अधिक पूंजी जोखिम में नहीं डालते।
- एक्सपर्ट RSI या MACD डाइवर्जेंस के साथ कन्फर्मेशन लेने की सलाह देते हैं।
प्रो टिप्स
- कॉन्फर्मेशन जरूरी: फिबोनैचि रिट्रेसमेंट या मूविंग एवरेज सपोर्ट के साथ और भी मजबूत।
- टाइमफ्रेम मायने रखता है: डेली/वीकली चार्ट पर ज्यादा विश्वसनीय।
कॉमन गलतियाँ और सावधानियाँ
गलतफहमियाँ
- नए ट्रेडर्स इसे साधारण थ्री-कैंडल पुलबैक समझ लेते हैं।
- तीसरी कैंडल पूरी बनने से पहले ही एंट्री ले लेना।
गलतियों से बचाव
- अनुभवी ट्रेडर्स वॉल्यूम पुष्टि के बिना एंट्री नहीं लेते।
- एक्सपर्ट क्लोजिंग प्राइस का इंतजार करने की सलाह देते हैं।
वैरिएशन और समान पैटर्न्स
समान पैटर्न
- मॉर्निंग स्टार – एक मजबूत तीन-कैंडल बुलिश रिवर्सल पैटर्न।
- ट्वीजर बॉटम – दो कैंडल्स वाला पैटर्न जिसमें लो एक जैसे होते हैं।
- बुलिश एनगल्फिंग – दो कैंडल्स वाला रिवर्सल पैटर्न।
क्विज़: अपना ज्ञान परखें
True or False
- सही या गलत: यूनिक थ्री रिवर बॉटम पैटर्न तभी पूरा माना जाता है जब तीसरी कैंडल एक डोजी या हैमर हो जिसकी लोअर विक लंबी हो।
- (उत्तर: सही – तीसरी कैंडल को निचले प्राइस को स्पष्ट रूप से रिजेक्ट करना चाहिए।)