
Candlestick Pattern
Bullish
Tweezer Bottom Candlestick ट्वीज़र बॉटम कैंडलस्टिक
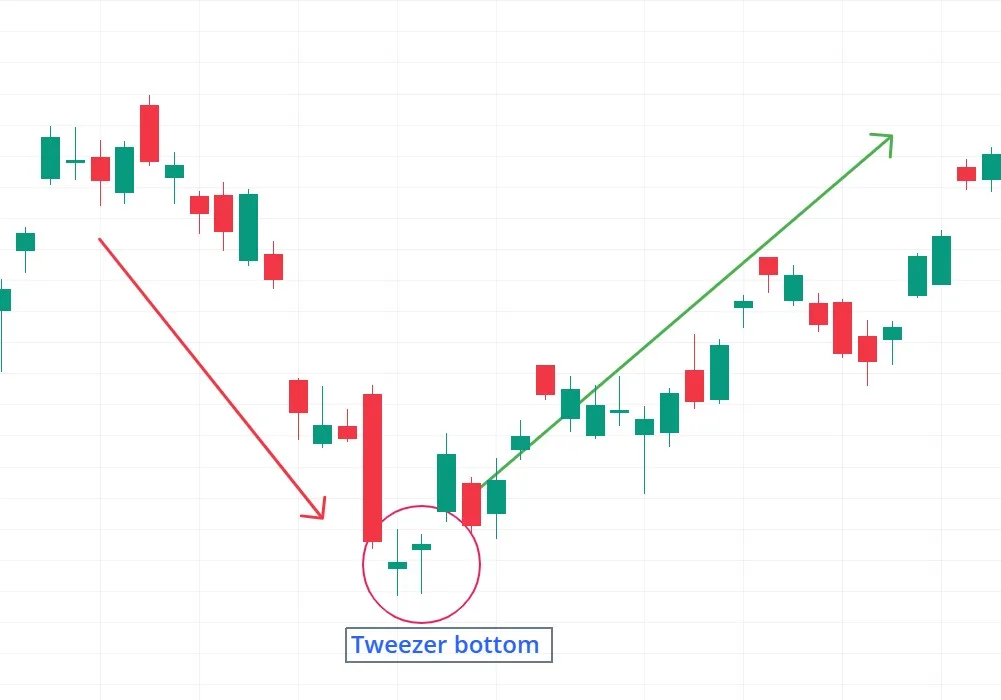
A bullish reversal pattern that appears at the end of a downtrend, signaling a potential trend reversal. एक बुलिश रिवर्सल पैटर्न जो डाउनट्रेंड के अंत में दिखाई देता है, जो संभावित ट्रेंड उलटफेर का संकेत देता है
Pattern Overview
Definition & Type
- A bullish reversal pattern that appears at the end of a downtrend, signaling a potential trend reversal.
- Consists of two (or more) candles with matching or near-matching lows, resembling "tweezers" pinning a bottom.
- The first candle is bearish, and the second is bullish, showing rejection of lower prices.
Reliability
- Considered a moderate-strength reversal signal, stronger when confirmed by volume or other indicators.
- More reliable when occurring at key support levels or after an extended decline.
Formation & Structure
Formation
- Number of Candles: 2 or more (classic version has two, but sometimes extends into a cluster).
- Visual Description:
- First Candle: A bearish (red/black) candle closing near its low.
- Second Candle: A bullish (green/white) candle with a similar low, forming a "double bottom" on the wicks.
- Key Identification Criteria:
- The lows must be nearly identical (exact matches are ideal but not mandatory).
- The second candle should show strong buying pressure (long lower wick or a solid bullish close).
Psychological Interpretation
- Market Sentiment:
- The first candle shows continued selling pressure, but the second candle reveals buyers stepping in at the same low.
- Indicates that sellers are losing control, and demand is absorbing supply.
- Behavior of Buyers/Sellers:
- Bears fail to push prices lower, while bulls defend the level, leading to a potential reversal.
Example with Analysis
- Example (XYZ Stock - Daily Chart):
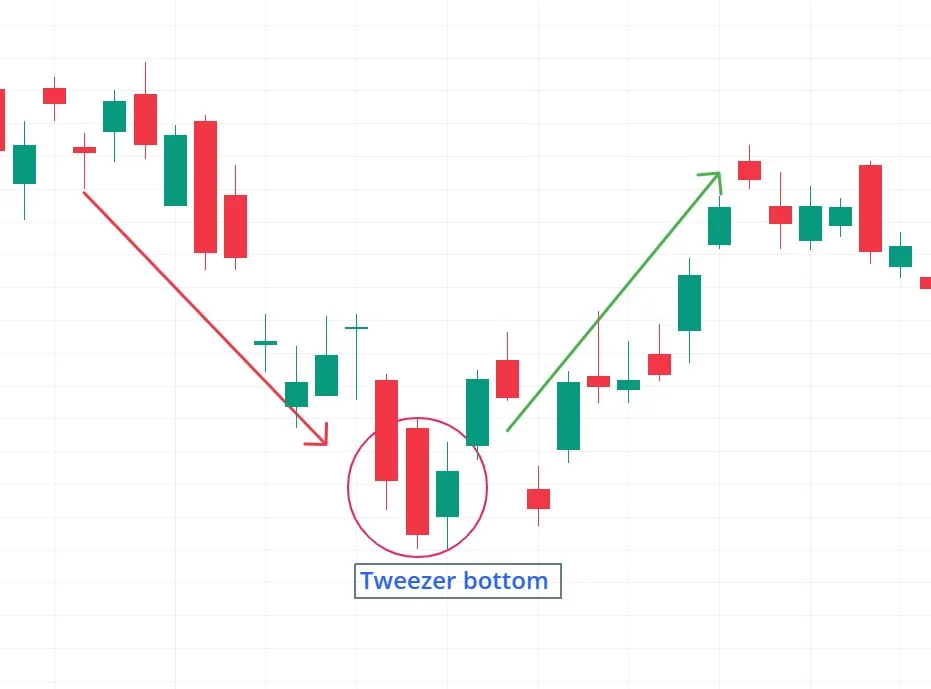
- Setup: After a downtrend, a long bearish candle forms, followed by a bullish candle with an identical low.
- Confirmation:
- The next candle breaks above the high of the second candle, confirming strength.
- Price Behavior:
- AAPL rallies 7% over the next five sessions.
Strategic Insights (As Shared by Traders)
Entry & Confirmation
- Traders often wait for a close above the high of the second candle before entering.
- Some look for increased volume on the bullish candle for added confirmation.
Trigger Point & Exit Point Targets
- Many place Trigger Point orders just below the tweezer lows to minimize risk.
- Exit Point targets are typically set at previous resistance levels or using a 1:2 or 1:3 risk-reward ratio.
Risk Management Principles
- Experienced traders risk no more than 1-2% of capital on a single trade.
- Experts emphasize avoiding trades during low liquidity (overnight or pre-market) due to false signals.
Pro Tips
- Stronger with Confluence: Works best when aligned with Fibonacci levels, moving averages, or trendline support.
- Multiple Tweezers = Stronger Signal: A cluster of tweezer bottoms (3+ candles with matching lows) increases reliability.
Common Pitfalls & Cautions
Misinterpretations
- New traders sometimes confuse it with a simple double bottom, but the Tweezer Bottom must have clear candlestick structure.
- Acting on tiny wick matches (minor lows) can lead to false signals.
Avoiding Mistakes
- Seasoned traders avoid trading Tweezers in choppy or sideways markets.
- Experts recommend waiting for a higher timeframe confirmation (e.g., 4H or daily) for stronger validity.
Variations & Similar Patterns
Similar Patterns
- Tweezer Top: The bearish counterpart in an uptrend, signaling potential reversal downward.
- Double Bottom: A broader pattern with two distinct lows (not necessarily candle-specific).
- Dragonfly Doji: A single-candle reversal with a long lower wick, showing strong rejection of lows.
Quiz: Test Your Knowledge
True or False
- The Tweezer Bottom pattern is equally reliable in trending and ranging markets.
- (Answer: False – It works best in clear downtrends, not choppy or sideways conditions.)
पैटर्न अवलोकन
परिभाषा और प्रकार
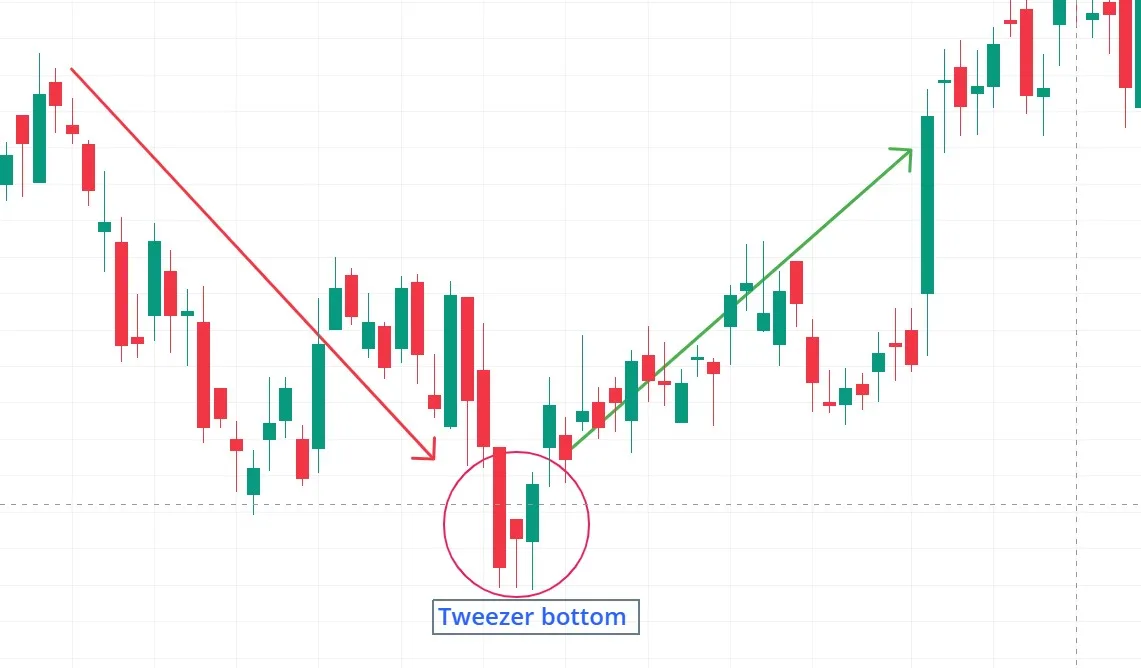
- एक बुलिश रिवर्सल पैटर्न जो डाउनट्रेंड के अंत में दिखाई देता है, जो संभावित ट्रेंड उलटफेर का संकेत देता है
- दो (या अधिक) कैंडल्स से बनता है जिनके लो समान या लगभग समान होते हैं, जैसे "ट्वीजर्स" द्वारा एक बॉटम बनाया गया हो
- पहली कैंडल मंदी (लाल) होती है, और दूसरी तेजी (हरी) होती है, जो निचले स्तरों को रिजेक्ट करती है
विश्वसनीयता
- मध्यम-शक्ति वाला रिवर्सल सिग्नल माना जाता है, वॉल्यूम या अन्य संकेतकों से पुष्टि होने पर मजबूत होता है
- मुख्य समर्थन स्तरों पर या लंबी गिरावट के बाद अधिक विश्वसनीय होता है
गठन और संरचना
गठन
- कैंडल्स की संख्या: 2 या अधिक (क्लासिक वर्जन में 2, लेकिन कभी-कभी क्लस्टर में बढ़ जाता है)
- दृश्य विवरण:
- पहली कैंडल: एक मंदी (लाल/काली) कैंडल जो अपने लो के नजदीक बंद होती है
- दूसरी कैंडल: एक तेजी (हरी/सफेद) कैंडल जिसका लो समान होता है, विक्स पर "डबल बॉटम" बनाती है
- मुख्य पहचान मानदंड:
- लो लगभग समान होने चाहिए (एकदम समान आदर्श है लेकिन अनिवार्य नहीं)
- दूसरी कैंडल को मजबूत खरीदारी दबाव दिखाना चाहिए (लंबी निचली विक या सॉलिड बुलिश क्लोज)
मनोवैज्ञानिक व्याख्या
- बाजार भावना:
- पहली कैंडल जारी बिकवाली दबाव दिखाती है, लेकिन दूसरी कैंडल उसी लो पर खरीदारों के प्रवेश को दर्शाती है
- संकेत देता है कि विक्रेता नियंत्रण खो रहे हैं, और मांग आपूर्ति को अवशोषित कर रही है
- खरीदार/विक्रेता व्यवहार:
- मंदियां कीमतों को और नीचे धकेलने में विफल होती हैं, जबकि तेजियां स्तर की रक्षा करती हैं, जिससे उलटफेर की संभावना बनती है
वास्तविक उदाहरण और विश्लेषण
- उदाहरण (स्टॉक: XYZ):
- सेटअप: डाउनट्रेंड के बाद एक लंबी मंदी कैंडल बनती है, उसके बाद एक तेजी कैंडल जिसका लो समान होता है
- पुष्टिकरण:
- अगली कैंडल दूसरी कैंडल के हाई से ऊपर बंद होती है, ताकत की पुष्टि करती है
- कीमत व्यवहार:
- AAPL अगले पांच सेशन में 7% चढ़ जाती है
रणनीतिक अंतर्दृष्टि (व्यापारियों के अनुभव से)
प्रवेश और पुष्टि
- अधिकांश व्यापारी दूसरी कैंडल के हाई से ऊपर बंद होने का इंतजार करते हैं
- कुछ अतिरिक्त पुष्टि के लिए वॉल्यूम में वृद्धि देखते हैं
Trigger Point और लक्ष्य
- कई Trigger Point ऑर्डर ट्वीजर लो से थोड़ा नीचे लगाते हैं
- लाभ लक्ष्य आमतौर पर पिछले प्रतिरोध स्तरों पर या 1:2 या 1:3 जोखिम-इनाम अनुपात पर सेट किए जाते हैं
जोखिम प्रबंधन सिद्धांत
- अनुभवी व्यापारी किसी भी ट्रेड में 1-2% से अधिक पूंजी जोखिम नहीं डालते
- विशेषज्ञ कम तरलता (रात्रि या प्री-मार्केट) के दौरान ट्रेड से बचने की सलाह देते हैं
प्रो टिप्स
- कन्फर्मेशन के साथ मजबूत होता है: फिबोनैचि स्तर, मूविंग एवरेज, या ट्रेंडलाइन सपोर्ट के साथ संरेखित होने पर सर्वोत्तम काम करता है
- एकाधिक ट्वीजर्स = मजबूत संकेत: ट्वीजर बॉटम का क्लस्टर (3+ कैंडल्स समान लो के साथ) विश्वसनीयता बढ़ाता है
सामान्य गलतियाँ और सावधानियां
गलत व्याख्याएं
- नए व्यापारी कभी-कभी इसे साधारण डबल बॉटम समझ लेते हैं, लेकिन ट्वीजर बॉटम में स्पष्ट कैंडलस्टिक संरचना होनी चाहिए
- छोटे विक मैच (मामूली लो) पर कार्रवाई करने से झूठे संकेत मिल सकते हैं
गलतियों से बचाव
- अनुभवी व्यापारी अस्थिर या साइडवेज मार्केट में ट्वीजर्स से बचते हैं
- विशेषज्ञ उच्च टाइमफ्रेम पुष्टि (जैसे 4H या दैनिक) की प्रतीक्षा करने की सलाह देते हैं
विविधताएं और समान पैटर्न
समान पैटर्न
- ट्वीजर टॉप: अपट्रेंड में मंदी का संकेत देने वाला समकक्ष
- डबल बॉटम: दो अलग लो वाला व्यापक पैटर्न (कैंडल-विशिष्ट नहीं)
- ड्रैगनफ्लाई डोजी: लंबी निचली विक वाली एकल कैंडल रिवर्सल, जो लो को मजबूती से रिजेक्ट करती है
प्रश्नोत्तरी: अपना ज्ञान परखें
True or False
- सही या गलत: ट्वीजर बॉटम पैटर्न ट्रेंडिंग और रेंजिंग दोनों मार्केट में समान रूप से विश्वसनीय होता है।
- उत्तर: गलत – यह स्पष्ट डाउनट्रेंड में सबसे अच्छा काम करता है, अस्थिर या साइडवेज स्थितियों में नहीं।