
Candlestick Pattern
Bullish
Stick Sandwich स्टिक सैंडविच
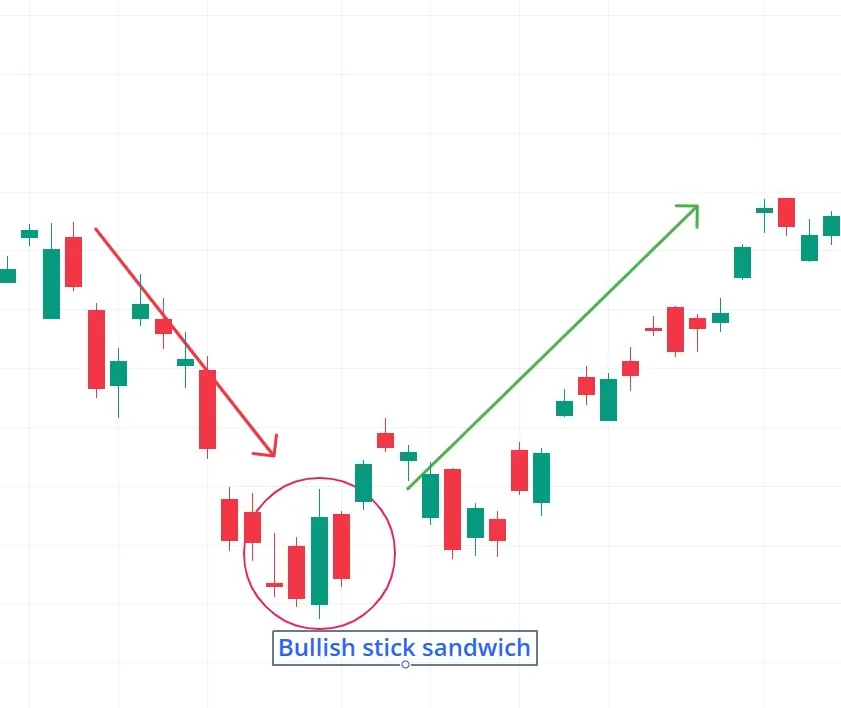
A bullish reversal pattern appearing at the end of a downtrend, signaling potential upward momentum. एक बुलिश रिवर्सल पैटर्न जो डाउनट्रेंड के अंत में दिखाई देता है, ऊपरी गति की संभावना का संकेत देता है
Pattern Overview
Definition & Type
- A bullish reversal pattern appearing at the end of a downtrend, signaling potential upward momentum.
- Composed of three candles: two bearish candles sandwiching one bullish candle.
Reliability
- Considered a moderate-strength reversal signal; stronger when confirmed by other indicators.
- More reliable at key support levels or in oversold conditions.
Formation & Structure
Formation
- Number of Candles: 3
- Visual Description:
- First Candle: Bearish (red/black).
- Second Candle: Bullish (green/white).
- Third Candle: Bearish closing at the same level as the first candle.
- Key Identification Criteria:
- Both bearish candles must have similar closing prices.
- The bullish candle should be completely contained within the range of the first candle.
Psychological Interpretation
- Market Sentiment:
- Initial selling pressure (first candle).
- Brief buying attempt (second candle).
- Final rejection of lower prices (third candle closing at first candle's close).
- Behavior of Buyers/Sellers:
- Bears fail to push prices lower despite two attempts.
- Bulls defend the price level, suggesting exhaustion of sellers.
Example with Analysis
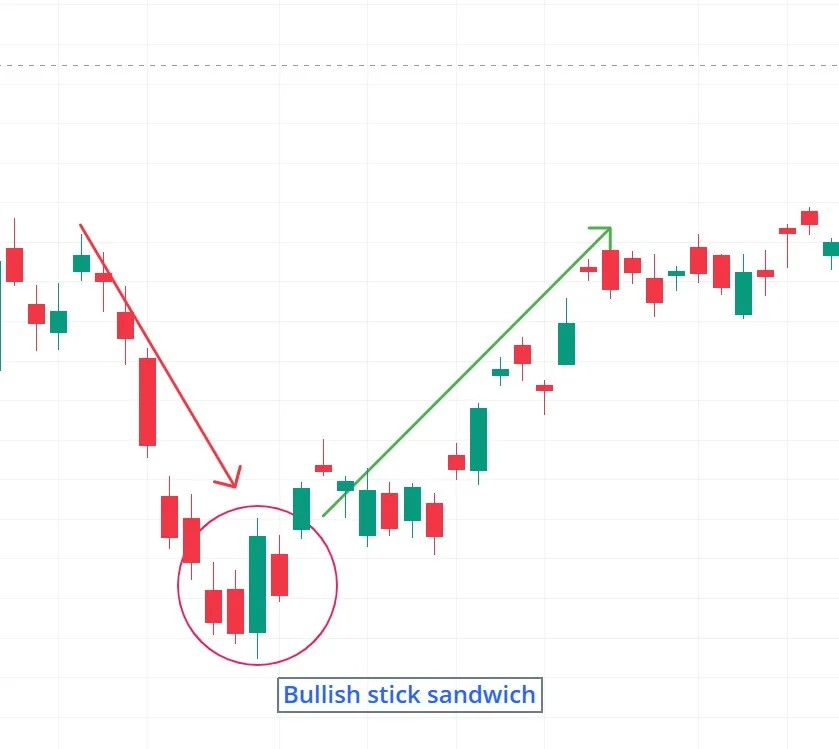
- Example (xyz – 4H Chart):
- Setup: After a 3-day decline, two bearish candles at 28,500 sandwich a bullish candle.
- Confirmation: Next candle breaks above the pattern’s high with increased volume.
- Price Behavior: xyz rallies 8 % over the next 24 hours.
Strategic Insights (As Shared by Traders)
Entry & Confirmation
- Traders often wait for a close above the highest high of the pattern.
- Many look for supporting volume on the breakout.
Trigger Point & Exit Point Targets
- Common Trigger Point placed below the pattern's low.
- Exit targets typically set at 1:2 or 1:3 risk-reward ratio.
Risk Management
- Experienced traders risk no more than 1–2 % of capital per trade.
- Experts recommend confirming with RSI or MACD before entry.
Pro Tips
- Stronger with confluence: Aligns best with Fibonacci levels or moving-average support.
- Timeframe matters: More reliable on 4H or daily charts.
Common Pitfalls & Cautions
Misinterpretations
- New traders often mistake any three-candle formation for this pattern.
- Acting when the third candle doesn't close at the first candle's level.
Avoiding Mistakes
- Seasoned traders avoid entries without volume confirmation.
- Experts recommend waiting for closing prices rather than intraday breaks.
Variations & Similar Patterns
Similar Patterns
- Bearish Stick Sandwich – Mirror pattern in uptrends.
- Morning Star – More potent three-candle reversal.
- Tweezer Bottom – Two-candle version with identical lows.
Quiz: Test Your Knowledge
True or False
- The Stick Sandwich pattern requires all three candles to have the same opening price to be valid.
- (Answer: False – Only the first and third candles need matching closes.)
पैटर्न अवलोकन
परिभाषा और प्रकार
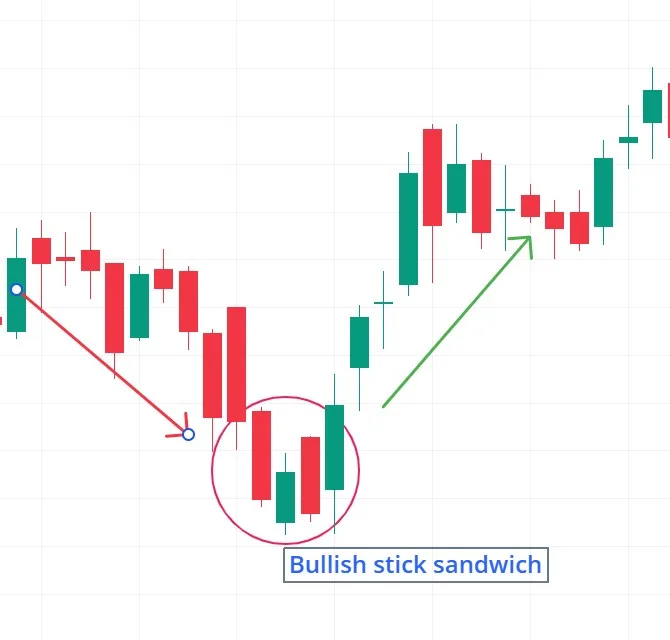
- एक बुलिश रिवर्सल पैटर्न जो डाउनट्रेंड के अंत में दिखाई देता है, ऊपरी गति की संभावना का संकेत देता है
- तीन कैंडल्स से बनता है: दो बेयरिश कैंडल्स के बीच एक बुलिश कैंडल सैंडविच की तरह
विश्वसनीयता
- मध्यम-शक्ति वाला रिवर्सल सिग्नल, अन्य संकेतकों से पुष्टि होने पर अधिक मजबूत
- मुख्य समर्थन स्तरों पर या ओवरसोल्ड कंडीशन में अधिक विश्वसनीय
गठन और संरचना
गठन
- कैंडल्स की संख्या: 3
- दृश्य विवरण:
- पहली कैंडल: बेयरिश (लाल/काली)
- दूसरी कैंडल: बुलिश (हरी/सफेद)
- तीसरी कैंडल: बेयरिश जो पहली कैंडल के समान स्तर पर बंद होती है
- मुख्य पहचान मानदंड:
- दोनों बेयरिश कैंडल्स का क्लोजिंग प्राइस समान होना चाहिए
- बुलिश कैंडल पूरी तरह से पहली कैंडल की रेंज के अंदर होनी चाहिए
मनोवैज्ञानिक व्याख्या
- बाजार भावना:
- प्रारंभिक बिकवाली दबाव (पहली कैंडल)
- अस्थायी खरीदारी का प्रयास (दूसरी कैंडल)
- निचले स्तरों की अंतिम अस्वीकृति (तीसरी कैंडल पहली के समान स्तर पर बंद)
- खरीदार/विक्रेता व्यवहार:
- मंदियां दो प्रयासों के बावजूद कीमतें नीचे नहीं ला पातीं
- तेजियां मूल्य स्तर की रक्षा करती हैं, विक्रेताओं की थकान का संकेत
उदाहरण और विश्लेषण
- उदाहरण (xyz – 4H चार्ट):
- सेटअप: 3-दिन की गिरावट के बाद $28,500 पर दो बेयरिश कैंडल्स के बीच एक बुलिश कैंडल बनती है
- पुष्टिकरण: अगली कैंडल बढ़े हुए वॉल्यूम के साथ पैटर्न के उच्च स्तर से ऊपर टूटती है
- कीमत व्यवहार: xyz अगले 24 घंटों में 8 % चढ़ जाता है
रणनीतिक अंतर्दृष्टि (व्यापारियों के अनुभव से)
प्रवेश और पुष्टि
- अधिकांश व्यापारी पैटर्न के उच्चतम स्तर से ऊपर बंद होने की प्रतीक्षा करते हैं
- कई ब्रेकआउट पर समर्थन वॉल्यूम देखते हैं
Trigger Point और लक्ष्य
- सामान्य Trigger Point पैटर्न के निचले स्तर से नीचे लगाया जाता है
- लाभ लक्ष्य सामान्यतः 1:2 या 1:3 जोखिम-इनाम अनुपात पर सेट होते हैं
जोखिम प्रबंधन सिद्धांत
- अनुभवी व्यापारी प्रति ट्रेड 1–2 % से अधिक पूंजी जोखिम में नहीं डालते
- विशेषज्ञ प्रवेश से पहले RSI या MACD से पुष्टि करने की सलाह देते हैं
प्रो टिप्स
- कन्फ़र्मेशन के साथ मजबूत: फिबोनैचि स्तर या मूविंग एवरेज सपोर्ट के साथ संरेखित होने पर सर्वोत्तम
- समय सीमा महत्वपूर्ण: 4H या दैनिक चार्ट पर अधिक विश्वसनीय
सामान्य गलतियाँ और सावधानियाँ
गलत व्याख्याएं
- नए व्यापारी अक्सर किसी भी तीन-कैंडल गठन को इस पैटर्न के रूप में गलत समझ लेते हैं
- उन पैटर्न पर कार्रवाई करना जहाँ तीसरी कैंडल पहली के स्तर पर बंद नहीं होती
गलतियों से बचाव
- अनुभवी व्यापारी वॉल्यूम पुष्टि के बिना प्रवेश से बचते हैं
- विशेषज्ञ इंट्राडे ब्रेक के बजाय क्लोजिंग प्राइस की प्रतीक्षा करने की सलाह देते हैं
विविधताएं और समान पैटर्न
समान पैटर्न
- बेयरिश स्टिक सैंडविच – अपट्रेंड में दिखाई देने वाला मिरर पैटर्न
- मॉर्निंग स्टार – अधिक शक्तिशाली तीन-कैंडल रिवर्सल
- ट्वीजर बॉटम – समान लो वाला दो-कैंडल वर्जन
प्रश्नोत्तरी: अपना ज्ञान परखें
True or False
- सही या गलत: स्टिक सैंडविच पैटर्न के लिए तीनों कैंडल्स का ओपनिंग प्राइस समान होना आवश्यक है।
- (उत्तर: गलत – केवल पहली और तीसरी कैंडल्स का क्लोजिंग प्राइस समान होना चाहिए)