
Candlestick Pattern
Bullish
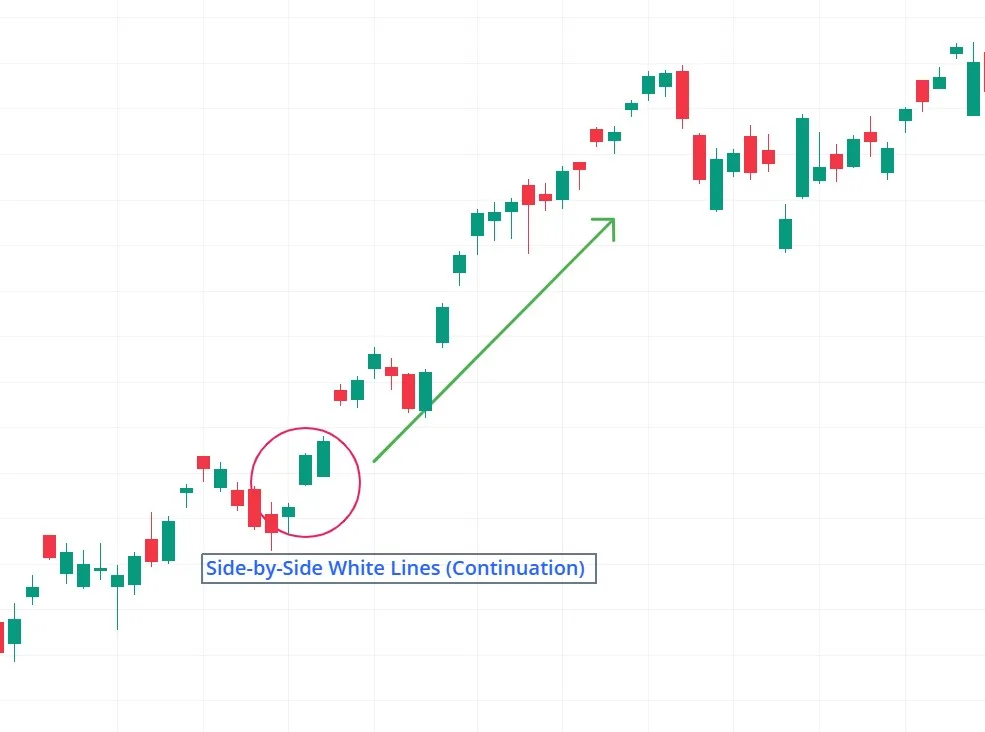
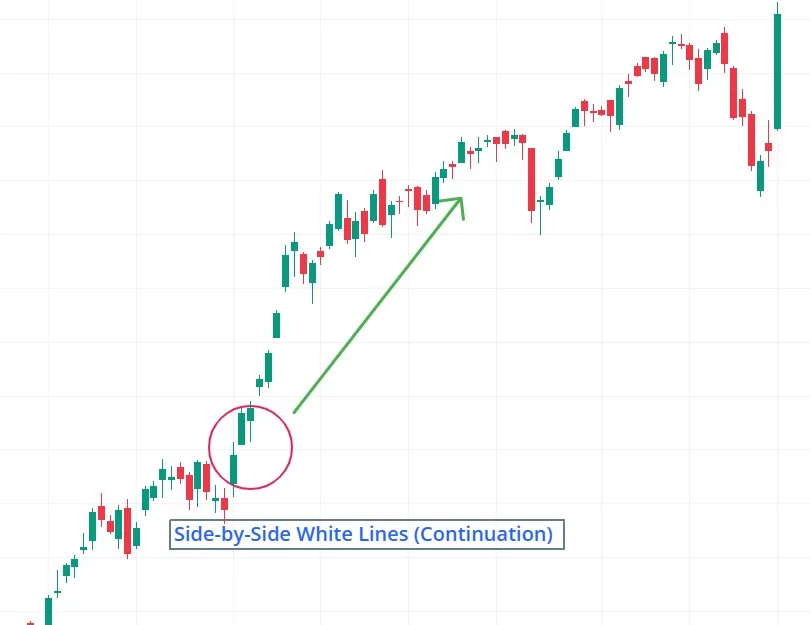
Side-by-Side White Lines साइड-बाय-साइड सफेद रेखाएँ
Bullish continuation pattern. बुलिश (तेजी) निरंतरता पैटर्न।
Pattern Overview
Type
- Bullish continuation pattern.
Reliability
- Moderate – high in uptrends; less reliable in choppy or bearish markets.
Appearance
- Two adjacent white (bullish) candlesticks with similar opens and closes.
Formation & Structure
Formation
- Number of Candles: 2 consecutive bullish candles.
- Visual Traits:
- Both candles have similar opening and closing prices (nearly equal heights).
- Small or negligible wicks → indicates strong buying pressure.
- Occurs during an established uptrend.
- Strict Identification Criteria:
- Second candle must open near the first candle’s open.
- Both candles must close near the same price level.
- Pattern should appear after brief consolidation or pullback in an uptrend.
Psychological Interpretation
- Sentiment Shift: Buyers regain dominance after minor hesitation.
- Fear/Greed Dynamics:
- Initial pause in buying (indecision).
- Second candle confirms sustained demand.
Real-World Example
- Asset: XYZ stock in an uptrend.
- Setup:
- Price pulls back slightly after a strong rally.
- Two white candles form side-by-side with matching opens & closes.
- Confirmation: Increased volume on the second candle.
- Subsequent Action: Price resumes upward movement.
Strategic Insights
Entry & Confirmation
- Wait for a close above the second candle’s high before entry.
- Supporting tools:
- RSI should not be overbought.
- Trendline breakout confirmation.
Trigger Point & Exit Targets
- Trigger: Break above the pattern’s high.
- Exit Targets:
- Measured move (height of prior trend segment).
- Nearest resistance level.
Risk Management
- Stop-loss placed below the pattern’s low; position size 1–2 % of capital.
Pro Tip
- “Always confirm with volume—lack of participation weakens the pattern.”
Common Pitfalls & Cautions
Misinterpretations
- Ignoring trend context—pattern must be in an uptrend.
- Mistaking it for a reversal signal.
Expert Caution
- False breakouts occur if volume is weak.
Variations & Similar Patterns
Similar Patterns
- Rising Three Methods (but uses more candles).
Unique Trait
- Requires nearly identical two-candle structure (unlike Three White Soldiers).
Quiz: Trader Knowledge Check
True or False
- The Side-by-Side White Lines pattern is valid in a downtrend.
- (Answer: False – it’s a continuation pattern for uptrends.)
पैटर्न का सिंहावलोकन
प्रकार
- बुलिश (तेजी) निरंतरता पैटर्न।
विश्वसनीयता
- अपट्रेंड में मध्यम से उच्च; रेंज-बाउंड या मंदी बाज़ार में कम प्रभावी।
दिखावट
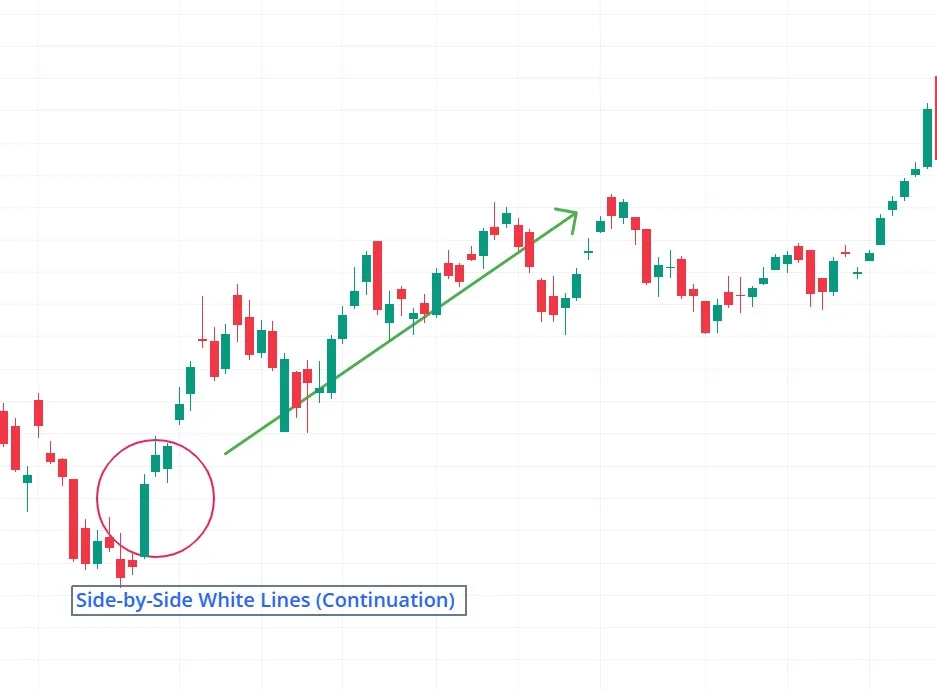
- दो सफ़ेद (बुलिश) कैंडल जिनके ओपन और क्लोज लगभग समान हों।
पैटर्न की संरचना
संरचना
- कैंडल की संख्या: 2 लगातार बुलिश कैंडल।
- विशेषताएँ:
- दोनों कैंडल का ओपन व क्लोज लगभग समान (लगभग समान ऊँचाई)।
- छोटी या नगण्य विक्स → मजबूत खरीद दबाव दर्शाती हैं।
- स्थापित अपट्रेंड के दौरान बनता है।
- सख्त पहचान शर्तें:
- दूसरी कैंडल का ओपन पहली कैंडल के ओपन के करीब होना चाहिए।
- दोनों कैंडल का क्लोज समान स्तर पर होना चाहिए।
- पैटर्न अपट्रेंड में छोटी पुलबैक/कंसोलिडेशन के बाद बनना चाहिए।
मनोवैज्ञानिक व्याख्या
- भावना में बदलाव: खरीदारों का फिर से दबदबा।
- डर/लालच का असर:
- पहली कैंडल में हल्का संकोच।
- दूसरी कैंडल खरीदारों का नियंत्रण पुष्टि करती है।
वास्तविक उदाहरण
- एसेट: XYZ शेयर अपट्रेंड में।
- सेटअप:
- तेजी के बाद हल्की पुलबैक।
- दो सफ़ेद कैंडल साथ-साथ बनती हैं, ओपन/क्लोज समान।
- पुष्टि: दूसरी कैंडल पर वॉल्यूम बढ़ा।
- अगली चाल: अपट्रेंड जारी रहा।
रणनीतिक सुझाव
एंट्री और पुष्टि
- एंट्री से पहले दूसरी कैंडल के हाई के ऊपर क्लोज का इंतज़ार करें।
- सहायक संकेतक:
- RSI ओवरबॉट न हो।
- ट्रेंडलाइन ब्रेकआउट की पुष्टि।
ट्रिगर और टारगेट
- ट्रिगर: पैटर्न के हाई के ऊपर ब्रेक।
- टारगेट:
- पिछले मूवमेंट जितना लक्ष्य।
- निकटतम प्रतिरोध स्तर।
रिस्क मैनेजमेंट
- स्टॉप-लॉस पैटर्न के लो के नीचे; पोज़िशन साइज पूंजी का 1–2 %।
प्रो टिप
- “हमेशा वॉल्यूम से पुष्टि करें—कम वॉल्यूम पर पैटर्न कमजोर होता है।”
सामान्य गलतियाँ और सावधानियाँ
गलत समझ
- ट्रेंड को नजरअंदाज करना—यह पैटर्न अपट्रेंड में ही काम करता है।
- इसे रिवर्सल पैटर्न समझ लेना।
एक्सपर्ट सलाह
- कम वॉल्यूम पर ब्रेकआउट झूठा हो सकता है।
इसी तरह के पैटर्न
समान पैटर्न
- राइजिंग थ्री मेथड्स (लेकिन इसमें अधिक कैंडल होती हैं)।
खास बात
- दोनों कैंडल लगभग एक जैसी होनी चाहिए (थ्री व्हाइट सोल्जर्स से अलग)।
क्विज़: व्यापारी ज्ञान परीक्षण
True or False
- सही या गलत: साइड-बाय-साइड व्हाइट लाइन्स पैटर्न डाउनट्रेंड में भी वैध है।
- (जवाब: गलत – यह पैटर्न केवल अपट्रेंड में काम करता है।)