
Candlestick Pattern
Bullish
Piercing Line Candlestick पियर्सिंग लाइन कैंडलस्टिक
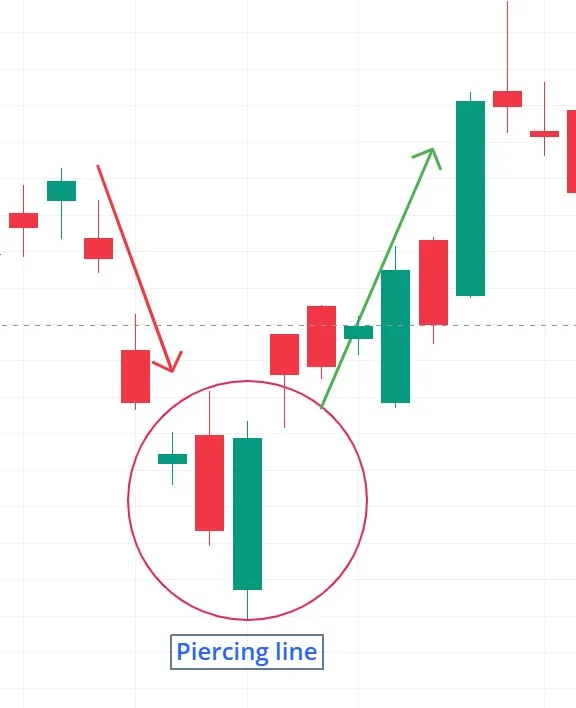
A two-candle bullish reversal pattern that appears after a downtrend. दो-कैंडल वाला बुलिश रिवर्सल पैटर्न
Pattern Overview
Definition & Type
- A two-candle bullish reversal pattern that appears after a downtrend.
- Signals potential trend reversal from bearish to bullish.
- Less aggressive than a Bullish Engulfing pattern but still significant.
General Reliability
- Moderately reliable, especially when confirmed by follow-up bullish candles.
- More effective when appearing near key support levels or in oversold conditions (RSI < 30).
Formation & Structure
Formation
- Number of Candles: 2 (first bearish, second bullish).
- Visual Description:
- First candle: Strong bearish (red/black) candle with a sizable body.
- Second candle: Bullish (green/white) candle that opens below the previous close but closes above the midpoint of the first candle's body.
- Key Identification Criteria:
- Must occur after a downtrend.
- The second candle does not fully engulf the first but pierces at least halfway into its body.
Psychological Interpretation
- Market Sentiment:
- Initial selling pressure (first candle) weakens as buyers step in aggressively (second candle).
- Shows rejection of lower prices and growing bullish momentum.
- Buyers vs. Sellers:
- If volume increases on the second candle, it confirms strong buying interest.
Example with Analysis
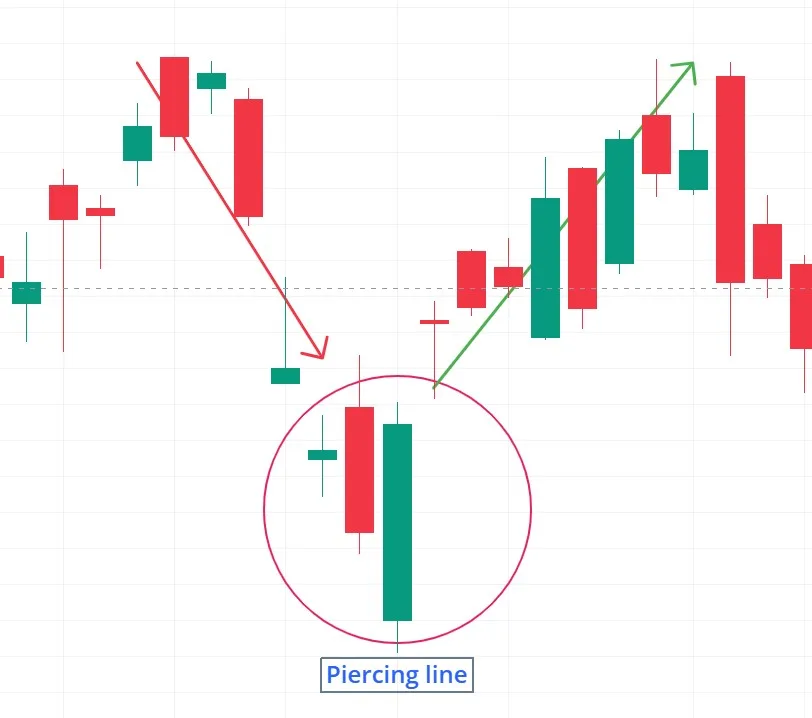
- Example (Stock: XYZ):
- After a steady decline, a long bearish candle forms, followed by a bullish candle opening lower but recovering past the first candle's 50% level.
- Confirmation:
- Next candle continues upward with higher volume.
- Price Behavior:
- Pair reverses into a short-term uptrend.
Strategic Insights (As Shared by Traders)
Entry & Confirmation
- Traders often wait for the next candle to close higher before entering.
- Some require the second candle to close above the first candle's midpoint for validation.
Trigger Point & Exit Point Targets
- Many place Trigger Point orders below the low of the second candle.
- Exit Point targets often set at previous swing highs or using a 1:2 risk-reward ratio.
Risk Management
- Experienced traders risk no more than 1-2% per trade.
- Avoid trading this pattern in choppy or low-volume markets.
Pro Tips
- "The pattern is stronger when the second candle closes near the first candle's open."
- "Combine with bullish divergence on the MACD for higher-probability setups."
Common Pitfalls & Cautions
Misinterpretations
- New traders sometimes confuse it with a Dark Cloud Cover (bearish counterpart).
- Acting without confirmation may lead to false reversals.
Expert Advice
- Seasoned traders avoid trading it during major economic news releases.
- Experts recommend checking higher timeframe trends for confluence.
Variations & Similar Patterns
Similar Patterns
- Bullish Engulfing (stronger, full-body engulfment).
- Morning Star (three-candle reversal pattern).
Key Difference
- Piercing Line requires only a 50%+ recovery, while Engulfing needs a full body engulf.
Quiz: Trader Knowledge Check
True or False
- A Piercing Line pattern is considered valid if it appears during an uptrend.
- (Answer: False – It's a reversal pattern that requires a prior downtrend.)
पैटर्न अवलोकन
परिभाषा और प्रकार
- दो-कैंडल वाला बुलिश रिवर्सल पैटर्न
- डाउनट्रेंड के बाद ट्रेंड उलटफेर का संकेत देता है
- बुलिश एंगल्फिंग पैटर्न से कमजोर परंतु महत्वपूर्ण
सामान्य विश्वसनीयता
- मध्यम विश्वसनीयता (पुष्टि के बाद)
- ओवरसोल्ड कंडीशन (RSI <30) में अधिक प्रभावी
गठन और संरचना
गठन
- कैंडल्स की संख्या: 2
- दृश्य विवरण:
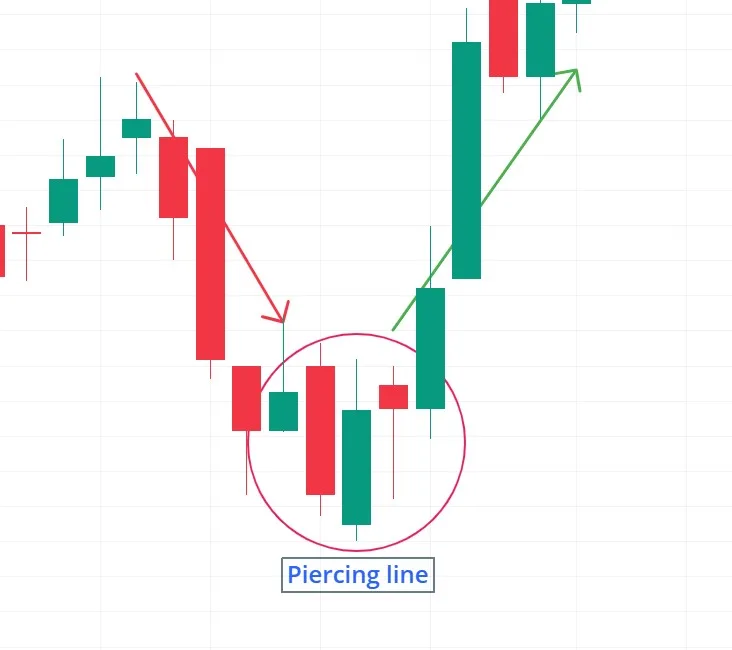
- पहली कैंडल: मजबूत मंदी (लाल) कैंडल
- दूसरी कैंडल: तेजी (हरी) कैंडल जो पहली कैंडल के बॉडी के 50% या अधिक को कवर करती है
- मुख्य पहचान मानदंड:
- स्पष्ट डाउनट्रेंड के बाद बनता है
- दूसरी कैंडल पहली कैंडल के मिडपॉइंट से ऊपर बंद होनी चाहिए
मनोवैज्ञानिक व्याख्या
- बाजार भावना:
- पहली कैंडल पर विक्रेताओं का दबाव
- दूसरी कैंडल पर खरीदारों का प्रवेश और मूल्य स्तरों को ऊपर धकेलना
- बिकवाली के दबाव में कमी और खरीदारी में रुचि का संकेत
वास्तविक उदाहरण और विश्लेषण
- उदाहरण (स्टॉक: xyz):
- 7 दिनों के गिरावट के बाद पियर्सिंग लाइन पैटर्न बना
- पुष्टि:
- अगली कैंडल पर मजबूत वॉल्यूम के साथ तेजी
- कीमत व्यवहार:
- 12% की रैली शुरू हुई
रणनीतिक अंतर्दृष्टि (व्यापारियों के अनुभव से)
प्रवेश और पुष्टि
- अधिकांश व्यापारी तीसरी कैंडल के तेजी में बंद होने की प्रतीक्षा करते हैं
- कुछ वॉल्यूम में वृद्धि को अतिरिक्त पुष्टि मानते हैं
Trigger Point और लक्ष्य
- अधिकांश पैटर्न के निचले स्तर से नीचे Trigger Point लगाते हैं
- लाभ लक्ष्य आमतौर पर पिछले स्विंग हाई या 1:2 जोखिम-इनाम अनुपात पर सेट किए जाते हैं
जोखिम प्रबंधन
- अनुभवी व्यापारी किसी भी ट्रेड में 1-2% से अधिक जोखिम नहीं लेते
- कम तरलता वाले बाजारों में इस पैटर्न से बचने की सलाह
प्रो टिप्स
- "जब यह पैटर्न प्रमुख समर्थन स्तर पर बनता है तो अधिक विश्वसनीय होता है"
- "RSI डायवर्जेंस के साथ संयोजन करने पर बेहतर परिणाम मिलते हैं"
सामान्य गलतियाँ और सावधानियां
गलत व्याख्याएं
- नए व्यापारी अक्सर इसे बुलिश एंगल्फिंग समझ लेते हैं (जबकि यह आंशिक कवरेज है)
- बिना पुष्टि के ट्रेड शुरू करना
विशेषज्ञ सलाह
- अनुभवी व्यापारी प्रमुख आर्थिक समाचारों के समय इस पैटर्न से बचते हैं
- विशेषज्ञ उच्च टाइमफ्रेम ट्रेंड की पुष्टि करने की सलाह देते हैं
विविधताएं और समान पैटर्न
समान पैटर्न
- बुलिश एंगल्फिंग (पूर्ण बॉडी कवरेज)
- हैमर (एकल कैंडल रिवर्सल पैटर्न)
मुख्य अंतर
- पियर्सिंग लाइन को 50% या अधिक कवरेज की आवश्यकता होती है
प्रश्नोत्तरी: व्यापारी ज्ञान परीक्षण
True or False
- सही या गलत: पियर्सिंग लाइन पैटर्न तभी वैध माना जाता है जब दूसरी कैंडल पहली कैंडल के पूरे बॉडी को कवर करे।
- (उत्तर: गलत - इसे केवल 50% या अधिक कवरेज की आवश्यकता होती है।)