
Candlestick Pattern
Bearish
Mat Hold मैट होल्ड
Continuation pattern (bearish) that forms during a downtrend and signals consolidation before trend resumption. कंटिन्यूएशन पैटर्न (मंदी) जो डाउनट्रेंड के दौरान बनता है और समेकन के बाद ट्रेंड जारी रहने का संकेत देता है।
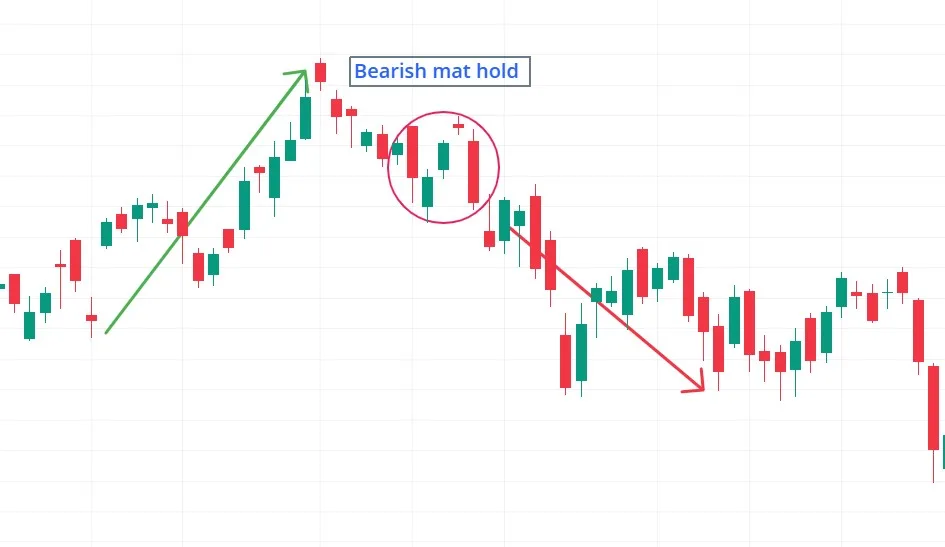
Pattern Overview
Type & Occurrence
- Continuation pattern (bearish) that forms during a downtrend and signals consolidation before trend resumption.
- Most reliable in strong trending markets with volume confirmation.
Formation & Structure
Formation
- Number of Candles: 5
- Visual Traits:
- 1st Candle: Strong bearish candle.
- 2nd–4th Candles: Three small-bodied candles (often bullish) that remain inside the 1st candle’s range and retrace ≤ 50 %.
- 5th Candle: Strong bearish candle closing below the consolidation range.
- Strict Identification Criteria:
- Must be in an established downtrend.
- Corrective candles cannot exceed 50 % of the 1st candle.
- 5th candle must break and close below consolidation.
Psychological Interpretation
- Sentiment Shift:
- Initial strong selling (1st candle).
- Temporary indecision / weak buying (2nd–4th candles).
- Bears decisively regain control (5th candle).
- Fear / Greed Dynamics:
- Buyers fail to sustain momentum, get trapped.
- Short-sellers add on breakdown.
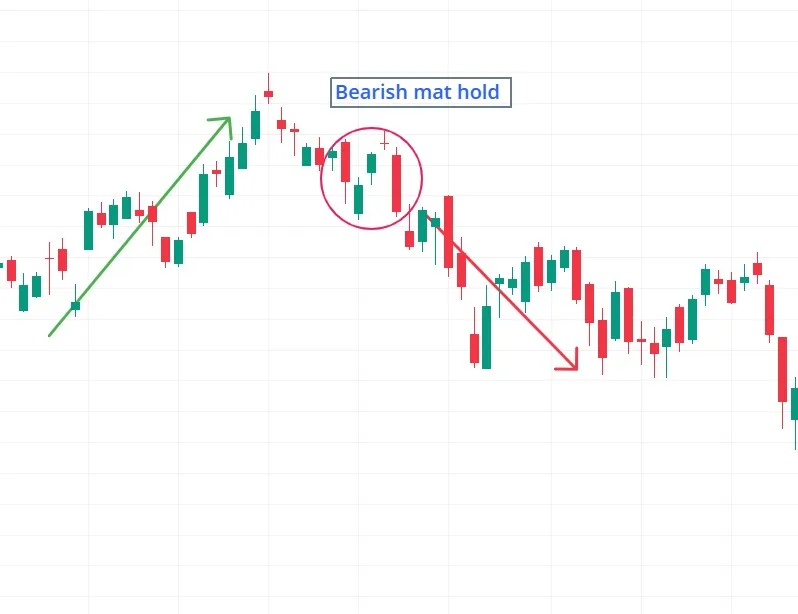
Example with Analysis
- XYZ Stock (daily):
- 1st Candle: −3 % long red candle.
- 2nd–4th: three small green candles (38 % retrace).
- 5th Candle: −4 % breakdown on 2× volume.
- Price drops 15 % in 5 sessions.
Strategic Insights
Entry & Confirmation
- Pattern confirmed when price closes below consolidation range (5th candle).
- Use volume (OBV, VWAP) and Fibonacci 38–50 % zone for confluence.
Trigger & Exit Targets
- Trigger: break below lowest point of consolidation.
- Targets: measured move (1 : 1) or previous swing low.
- Stop-loss: above highest point of consolidation.
Risk Management
- Risk 1–2 % of account per trade.
- Trail to breakeven at 1.5× risk.
Pro Tip
- Watch for failed bullish attempts inside consolidation — often an early warning of breakdown.
Common Pitfalls & Cautions
Misinterpretations
- Acting on patterns with > 50 % retrace (invalid).
- Ignoring volume confirmation on breakout.
Expert Caution
- False breakdowns common near major support—confirm with order-flow depth.
Variations & Similar Patterns
Similar Patterns
- Bearish Flag – consolidation channel.
- Mat Hold: defined 5-candle structure inside 1st candle range.
Quiz: Trader Knowledge Check
Multiple Choice
- The Mat Hold pattern is complete when:
- a) Price makes higher highs in consolidation.
- b) The 5th candle closes below consolidation range. ✔
- c) Volume decreases on breakout.
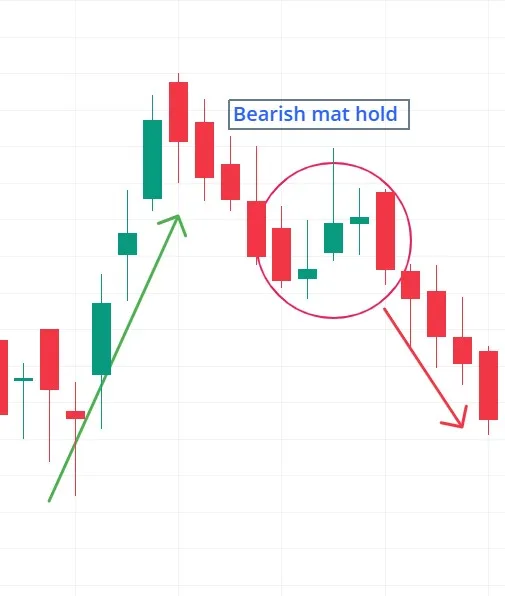
पैटर्न अवलोकन
प्रकार और घटना
- कंटिन्यूएशन पैटर्न (मंदी) जो डाउनट्रेंड के दौरान बनता है और समेकन के बाद ट्रेंड जारी रहने का संकेत देता है।
- मजबूत ट्रेंड में वॉल्यूम पुष्टि के साथ सबसे विश्वसनीय।
गठन और संरचना
गठन
- कैंडल्स की संख्या: 5
- दृश्य विशेषताएँ:
- पहली कैंडल: मजबूत बेयरिश कैंडल।
- दूसरी–चौथी: तीन छोटी बॉडी वाली कैंडल्स (अक्सर बुलिश) जो पहली कैंडल की रेंज में रहती हैं और 50 % रिट्रेसमेंट से अधिक नहीं जातीं।
- पाँचवी कैंडल: समेकन रेंज से नीचे बंद होने वाली मजबूत बेयरिश कैंडल।
- सख्त मानदंड:
- स्थापित डाउनट्रेंड में होना चाहिए।
- करेक्टिव कैंडल्स पहली कैंडल का 50 % पार न करें।
- 5वीं कैंडल समेकन से नीचे बंद हो।
मनोवैज्ञानिक व्याख्या
- भावना परिवर्तन:
- प्रारंभिक मजबूत बिकवाली (1ली कैंडल).
- अस्थायी अनिश्चितता / कमजोर खरीदारी (2-4 कैंडल्स).
- 5वीं कैंडल पर मंदड़ियाँ नियंत्रण में आती हैं।
- डर / लालच:
- खरीदार गति बनाए नहीं रख पाते, फँसते हैं।
- ब्रेकडाउन पर शॉर्ट-सेलर्स नई पोज़ीशन लेते हैं।
उदाहरण और विश्लेषण
- XYZ स्टॉक (दैनिक):
- 1ली कैंडल: −3 % लंबी लाल कैंडल।
- 2-4: तीन छोटी हरी कैंडल्स (38 % रिकवरी)।
- 5वीं कैंडल: वॉल्यूम 2× पर −4 % ब्रेकडाउन।
- 5 सत्रों में कीमत 15 % गिरती है।
रणनीतिक अंतर्दृष्टि
एंट्री और पुष्टि
- पैटर्न तब वैध होता है जब कीमत समेकन के नीचे बंद हो (5वीं कैंडल).
- वॉल्यूम संकेतक व फिबोनैचि 38-50 % ज़ोन को भी देखें।
ट्रिगर और लक्ष्य
- ट्रिगर: समेकन के निचले स्तर का ब्रेक.
- लक्ष्य: 1 : 1 मापा मूव या पिछला स्विंग लो.
- स्टॉप-लॉस: समेकन के उच्चतम बिंदु के ऊपर.
रिस्क मैनेजमेंट
- प्रति ट्रेड 1–2 % खाते का जोखिम लें.
- 1.5× जोखिम पर स्टॉप ब्रेकईवन पर लाएँ.
प्रो टिप
- समेकन के दौरान विफल बुलिश प्रयासों पर नजर रखें — ये ब्रेकडाउन का प्रारंभिक संकेत होते हैं।
सामान्य गलतियाँ और सावधानियाँ
गलत व्याख्या
- 50 % से अधिक रिट्रेसमेंट वाले पैटर्न पर कार्रवाई करना.
- ब्रेकआउट पर वॉल्यूम पुष्टि की अनदेखी.
विशेषज्ञ चेतावनी
- प्रमुख सपोर्ट के पास झूठे ब्रेकडाउन हो सकते हैं — ऑर्डर-फ्लो से पुष्टि करें.
विविधताएँ और समान पैटर्न
समान पैटर्न
- बेयरिश फ्लैग – समेकन चैनल.
- मैट होल्ड: 5-कैंडल संरचना, पहली कैंडल की रेंज में सीमित.
क्विज़
Multiple Choice
- मैट होल्ड पैटर्न पूरा होता है जब:
- a) समेकन में कीमत उच्चतर उच्च बनाए
- b) 5वीं कैंडल समेकन रेंज से नीचे बंद हो ✔
- c) ब्रेकआउट पर वॉल्यूम कम हो