
Candlestick Pattern
Bullish
High Wave Pattern हाई वेव पैटर्न
Single-candle ‘indecision’ pattern with very small body and long (≈ 3× body) upper & lower wicks. एकल मोमबत्ती वाला ‘अनिर्णय’ पैटर्न – छोटा बॉडी और ऊपर-नीचे लंबी बत्तियाँ (≈ 3× बॉडी)।
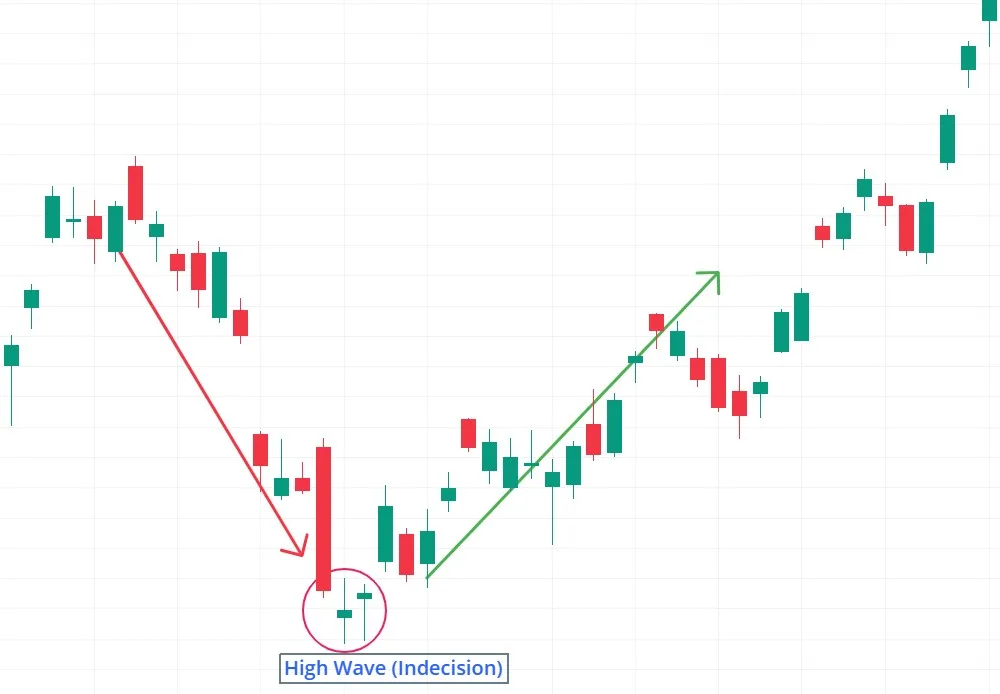
Pattern Overview
Definition & Type
- Single-candle ‘indecision’ pattern with very small body and long (≈ 3× body) upper & lower wicks.
- Neutral: highlights trend weakness rather than clear reversal/continuation bias.
Reliability
- Best inside range-bound or low-momentum markets––shows hesitation.
- Weaker signal during strong directional trends unless accompanied by breakout.
Formation & Structure
Candle Anatomy
- Body ≤ ~15 % of the full high-low range.
- Upper & lower shadows roughly equal and ≥ 3× body.
- Body tends to sit near the mid-range of the candle.
Strict Identification Rules
- Wicks must dwarf the real body.
- Upper & lower shadows should be of similar length (±10 %).
Psychological Interpretation
- Bulls and bears push price aggressively in both directions but end near stalemate.
- Signals indecision / tug-of-war; market awaiting fresh catalyst before trending.
Example with Analysis
- XYZ range-bound for 2 days (~₹148–₹152).
- Day-3 prints High-Wave candle (₹147–₹153) with tiny ₹0.20 body.
- Volume below 20-day average; RSI ≈ 50 ⇒ neutrality confirmed.
Strategic Insights
Entry & Confirmation
- Treat as a volatility coil: enter ONLY after candle high breaks (bull) or low breaks (bear) with volume surge.
- Combine with S/R zones and ATR for realistic targets.
Triggers, Targets & Stops
- Trigger = break > High-Wave high or < low.
- Target = nearest S/R or 1×ATR.
- Stop = opposite wick extreme; risk ≤ 1 %.
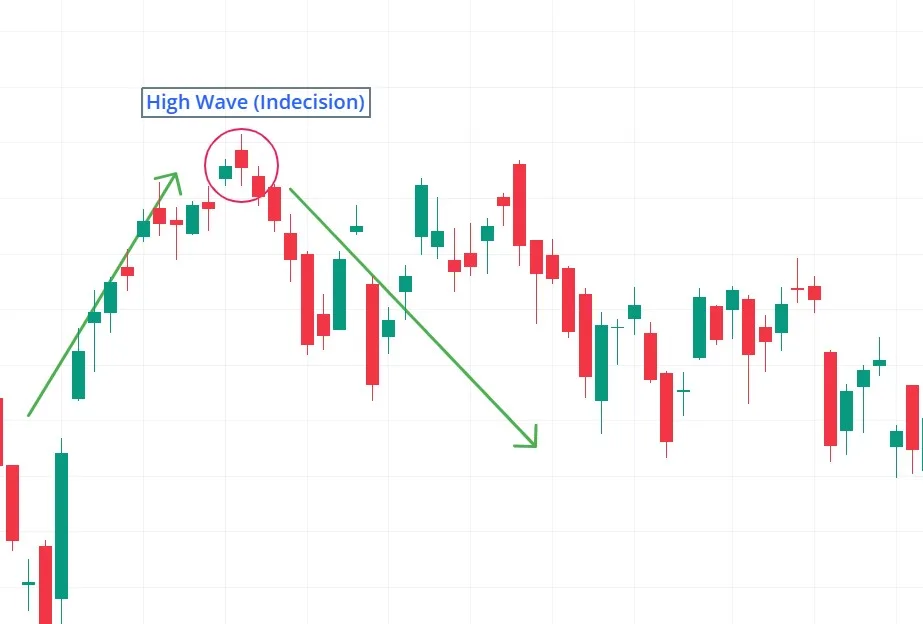
Common Pitfalls & Cautions
- Treating a single High-Wave as reversal without breakout.
- Ignoring volume—low-volume ‘breaks’ often fail.
Similar Patterns
- Doji – smaller wicks vs body.
- Long-Legged Doji – similar shadows but body at extreme, not centre.
Quiz
- True or False: A High-Wave candle is a standalone trading signal.
- Answer: False – confirmation is mandatory.
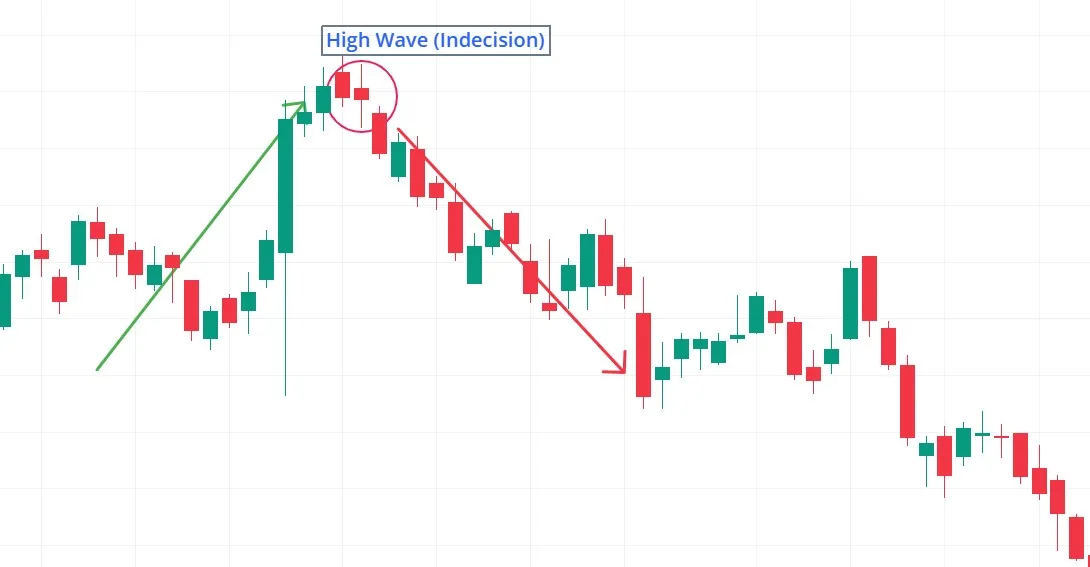
पैटर्न का ओवरव्यू
परिभाषा व प्रकार
- एकल मोमबत्ती वाला ‘अनिर्णय’ पैटर्न – छोटा बॉडी और ऊपर-नीचे लंबी बत्तियाँ (≈ 3× बॉडी)।
- तटस्थ संकेत: ट्रेंड की कमजोरी दर्शाता है, स्पष्ट तेजी/मंदी नहीं।
विश्वसनीयता
- रेंज-बाउंड बाज़ार में अधिक मायने रखता है।
- मजबूत ट्रेंड में कमजोर, जब तक ब्रेकआउट न हो।
गठन व संरचना
कैंडल रचना
- बॉडी कुल रेंज का ~15 % या कम।
- ऊपरी-निचली बत्ती लगभग बराबर, बॉडी से ≥ 3× लंबी।
- बॉडी आमतौर पर रेंज के मध्य के करीब।
सख्त पहचान नियम
- बत्तियाँ बॉडी से कहीं लंबी हों।
- ऊपरी-निचली बत्ती में लंबाई का अंतर 10 % से कम।
मनोवैज्ञानिक व्याख्या
- खरीदार-विक्रेता दोनों तेजी से प्राइस घुमाते हैं पर संतुलन।
- अनिर्णय, नया ट्रेंड शुरू होने से पहले ठहराव।
उदाहरण व विश्लेषण
- XYZ दो दिन से रेंज (₹148–₹152)।
- तीसरे दिन हाई-वेव – ₹147–₹153, बॉडी सिर्फ ₹0.20।
- वॉल्यूम औसत से कम, RSI 50 पर – अनिर्णय का संकेत।
रणनीतिक सुझाव
प्रवेश व पुष्टि
- सिर्फ तब ट्रेड करें जब उच्च/निम्न ब्रेक वॉल्यूम स्पाइक के साथ हो।
- सपोर्ट/रेज़िस्टेंस व ATR टार्गेट्स मिलाएँ।
ट्रिगर, लक्ष्य व स्टॉप
- ट्रिगर: हाई/लो का ब्रेक।
- लक्ष्य: नजदीकी सपोर्ट/रेज़िस्टेंस या 1×ATR।
- स्टॉप: विपरीत बत्ती से बाहर; जोखिम ≤ 1 %.
सामान्य गलतियाँ व सावधानियाँ
- ब्रेकआउट के बिना इसे रिवर्सल मान लेना।
- वॉल्यूम अनदेखा करने से झूठे ब्रेक बढ़ते हैं।
मिलते-जुलते पैटर्न
- डोजी – बत्तियाँ उतनी लंबी नहीं।
- लॉन्ग-लेग्ड डोजी – बत्तियाँ लंबी, पर बॉडी मध्य में नहीं।
क्विज़
- सही या गलत: हाई-वेव कैंडल अपने-आप ट्रेड सिग्नल देती है।
- उत्तर: गलत – पुष्टि आवश्यक है।