
Candlestick Pattern
Bullish
Bullish Harami बुलिश हरामी
A bullish reversal pattern that appears during a downtrend, signaling potential upward momentum. दो-कैंडल बुलिश रिवर्सल पैटर्न
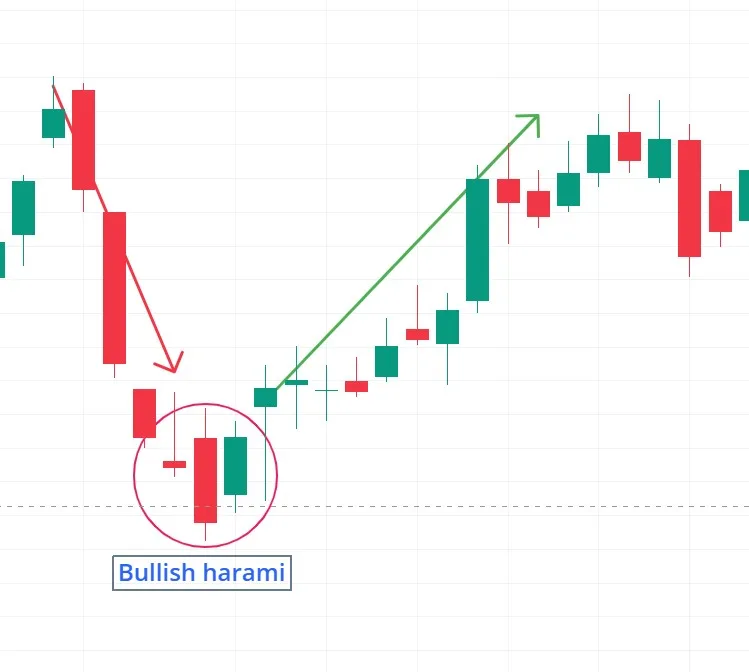
Pattern Overview
Definition & Type
- A bullish reversal pattern that appears during a downtrend, signaling potential upward momentum.
- Consists of two candles: a large bearish candle followed by a smaller bullish candle fully contained within the prior candle’s body.
Reliability
- Considered moderately reliable, especially when confirmed by other indicators (e.g., volume, support levels).
- Works best in strong downtrends where selling exhaustion becomes evident.
Formation & Structure
- Number of Candles: 2
- Visual Description:
- First Candle: A long bearish (red/black) candle, showing strong selling pressure.
- Second Candle: A smaller bullish (green/white) candle that fits entirely within the first candle’s body.
- Key Identification Criteria:
- The second candle must not exceed the high or low of the first candle.
- The smaller the second candle, the stronger the reversal signal.
Psychological Interpretation
- Market Sentiment:
- The first candle reflects strong bearish control, but the second candle shows weakening selling pressure.
- Buyers start stepping in, but cautiously, leading to a smaller bullish candle.
- Behavior of Buyers/Sellers: Sellers fail to push prices lower, while buyers begin accumulating, setting up a potential reversal.
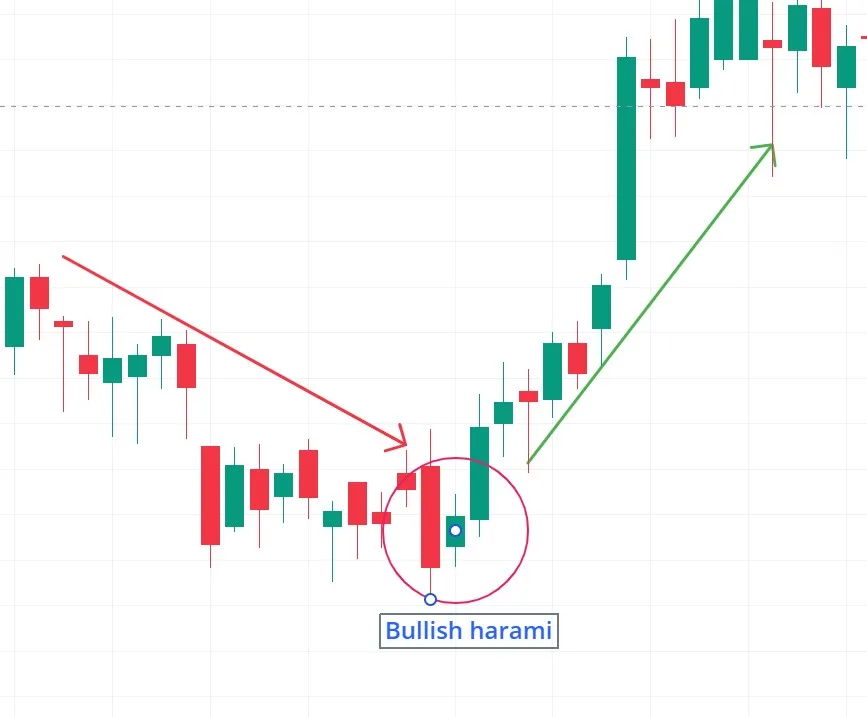
Example with Analysis
- Example (Stock:- XYZ):
- Setup: After a prolonged downtrend, a large bearish candle forms, followed by a small bullish candle inside its range.
- Confirmation: The next candle breaks above the first candle’s high, confirming the reversal.
- Price Behavior: BTC rallies 5% over the next few candles.
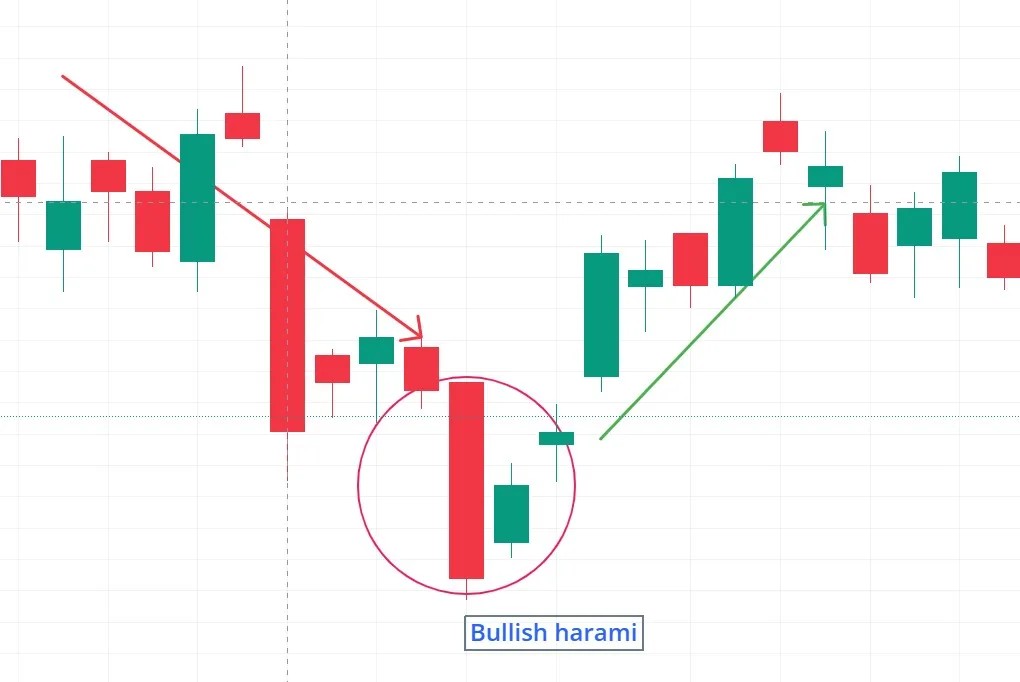
पैटर्न अवलोकन
परिभाषा और प्रकार
- दो-कैंडल बुलिश रिवर्सल पैटर्न
- डाउनट्रेंड के बाद ट्रेंड उलटफेर का संकेत देता है
- "हरामी" जापानी शब्द है जिसका अर्थ है "गर्भवती" - छोटी कैंडल बड़ी कैंडल के अंदर होती है
सामान्य विश्वसनीयता
- मध्यम विश्वसनीयता (पुष्टि की आवश्यकता)
- ओवरसोल्ड कंडीशन (RSI <30) में अधिक प्रभावी
- 68% सफलता दर (3-दिन के टाइमफ्रेम में)
गठन और संरचना
- कैंडल्स की संख्या: 2
- दृश्य विवरण:
- पहली कैंडल: लंबी मंदी (लाल) कैंडल
- दूसरी कैंडल: छोटी तेजी (हरी) कैंडल जो पूरी तरह पहली कैंडल के बॉडी के अंदर है
- मुख्य पहचान मानदंड:
- स्पष्ट डाउनट्रेंड के बाद बनता है
- दूसरी कैंडल का ओपन और क्लोज दोनों पहली कैंडल के बॉडी के अंदर होने चाहिए
- दूसरी कैंडल का बॉडी पहली कैंडल के बॉडी से काफी छोटा होना चाहिए
मनोवैज्ञानिक व्याख्या
- बाजार भावना:
- पहली कैंडल पर मजबूत बिकवाली दबाव
- दूसरी कैंडल पर बिकवाली में कमी और खरीदारी में रुचि
- बाजार में अनिश्चितता और संभावित ट्रेंड रिवर्सल का संकेत
वास्तविक उदाहरण और विश्लेषण
- उदाहरण (स्टॉक: XYZ):
- 5 दिनों के गिरावट के बाद बुलिश हरामी पैटर्न बना
- पुष्टिकरण: अगली कैंडल पर मजबूत वॉल्यूम के साथ तेजी
- कीमत व्यवहार: 8% की रैली शुरू हुई
- सेटअप: 200-दिन मूविंग एवरेज के नजदीक बना रणनीतिक अंतर्दृष्टि (व्यापारियों के अनुभव से)