
Candlestick Pattern
Bullish
Belt Hold बेल्ट होल्ड
A strong bullish reversal pattern that appears at the end of a downtrend, signaling potential upward momentum. एक मजबूत बुलिश रिवर्सल पैटर्न जो डाउनट्रेंड के अंत में दिखाई देता है, ऊपरी गति की संभावना का संकेत देता है
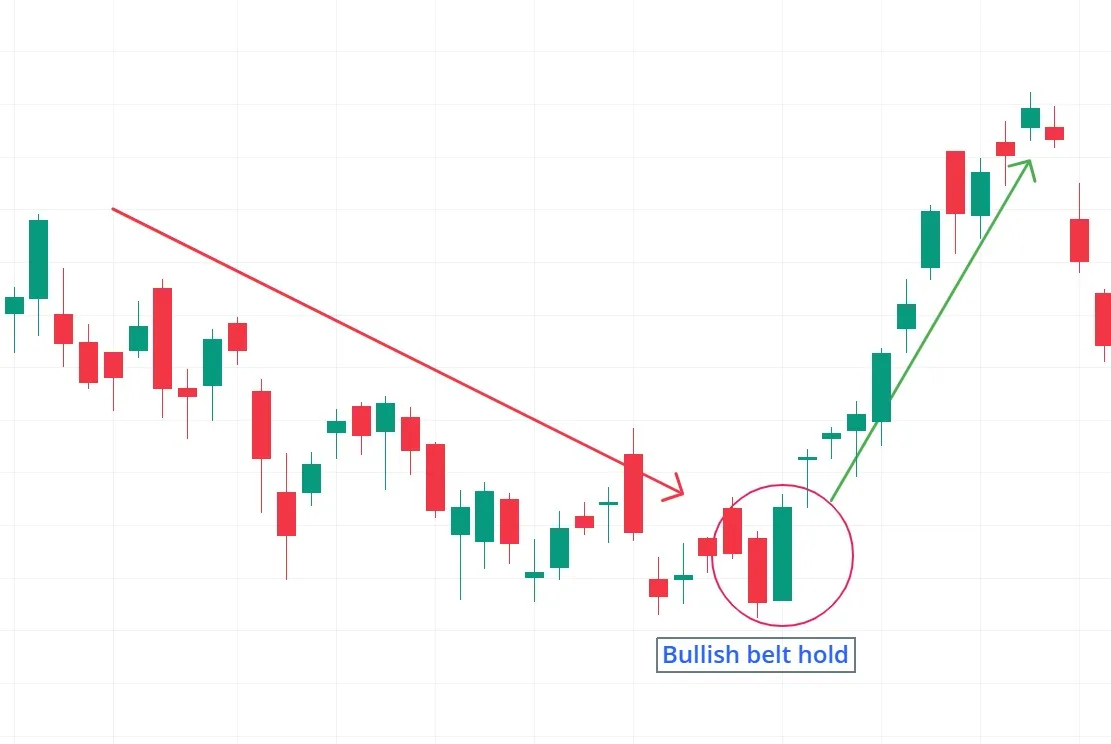
Pattern Overview
Definition & Type
- A strong bullish reversal pattern that appears at the end of a downtrend, signaling potential upward momentum.
- Composed of a single candle with a long bullish body, little to no lower wick, and a small or nonexistent upper wick.
Reliability
- Considered a high-probability reversal signal when confirmed by volume or other technical indicators.
- Most effective when appearing after an extended decline or at key support levels.
Formation & Structure
Formation
- Number of Candles: 1
- Visual Description:
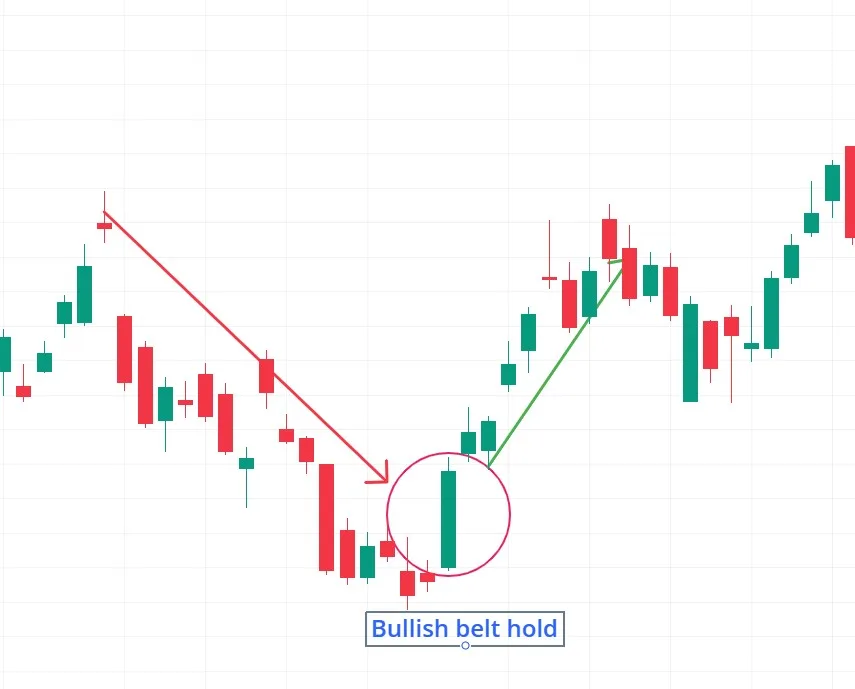
- Body: Long bullish (green/white) candle, indicating strong buying pressure.
- Wicks:
- Lower wick: Very small or absent (shows price opened near the low and rallied).
- Upper wick: Minimal (suggests buyers maintained control throughout the session).
- Key Identification Criteria:
- Must form after a clear downtrend.
- The candle should open at or near its low and close near its high.
Psychological Interpretation
- Market Sentiment:
- The pattern reflects a sudden shift from bearish to bullish sentiment.
- Buyers aggressively step in at the open, preventing further declines and pushing prices higher.
- Behavior of Buyers/Sellers:
- Bears lose control as bulls dominate the entire session, signaling potential trend reversal.
Example with Analysis
- Example (STOCK: XYZ):
- Setup: After a 5-day decline, a Belt Hold candle forms, opening at the low and rallying to close near the high.
- Confirmation:
- The next candle continues upward with higher volume, confirming the reversal.
- Price Behavior:
- xyz gains 6% over the next three trading sessions.
Strategic Insights (As Shared by Traders)
Entry & Confirmation
- Traders often enter on the close of the Belt Hold candle or after a follow-through bullish candle.
- Some wait for a break above the candle's high for additional confirmation.
Trigger Point & Exit Point Targets
- Many place Trigger Point orders below the Belt Hold candle's low to protect against false reversals.
- Exit Point targets are typically set at prior resistance levels or using a 1:3 risk-reward ratio.
Risk Management Principles
- Experienced traders risk no more than 1-2% of capital per trade.
- Experts recommend avoiding trades during low liquidity periods (e.g., pre-market or holidays).
Pro Tips
- Volume Matters: A surge in buying volume increases the pattern's reliability.
- Stronger on Higher Timeframes: More significant on daily/weekly charts than intraday timeframes.
Common Pitfalls & Cautions
Misinterpretations
- New traders sometimes mistake any long bullish candle for a Belt Hold, but the open must be near the low.
- Acting on Belt Holds in choppy or sideways markets often leads to false signals.
Avoiding Mistakes
- Seasoned traders avoid entries without confirmation (e.g., waiting for the next candle to close higher).
- Experts recommend combining with trendlines or moving averages for stronger validation.
Variations & Similar Patterns
Similar Patterns
- Belt Hold (Bearish): The opposite pattern in an uptrend, signaling potential bearish reversal.
- Marubozu: A candle with no wicks, indicating extreme bullish or bearish dominance.
- Hammer: Similar to Belt Hold but has a small body and long lower wick.
Quiz: Test Your Knowledge
True or False
- The Bullish Belt Hold pattern is equally reliable in both trending and ranging markets.
- (Answer: False – It works best in clear downtrends, not choppy or sideways conditions.)
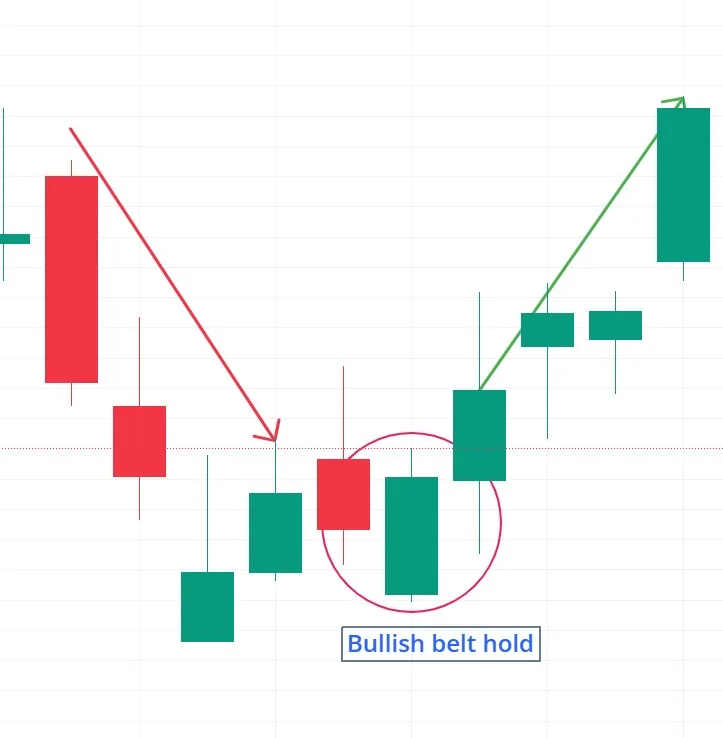
पैटर्न अवलोकन
परिभाषा और प्रकार
- एक मजबूत बुलिश रिवर्सल पैटर्न जो डाउनट्रेंड के अंत में दिखाई देता है, ऊपरी गति की संभावना का संकेत देता है
- एकल कैंडल से बनता है जिसमें लंबा बुलिश बॉडी, बहुत छोटी या अनुपस्थित निचली विक, और छोटी या अनुपस्थित ऊपरी विक होती है
विश्वसनीयता
- वॉल्यूम या अन्य तकनीकी संकेतकों से पुष्टि होने पर उच्च संभावना वाला रिवर्सल सिग्नल माना जाता है
- लंबी गिरावट के बाद या मुख्य समर्थन स्तरों पर सबसे प्रभावी
गठन और संरचना
गठन
- कैंडल्स की संख्या: 1
- दृश्य विवरण:
- बॉडी: लंबा तेजी (हरी/सफेद) कैंडल, मजबूत खरीदारी दबाव दिखाता है
- विक्स:
- निचली विक: बहुत छोटी या अनुपस्थित (दर्शाता है कि कीमत निचले स्तर पर खुली और ऊपर चढ़ी)
- ऊपरी विक: न्यूनतम (संकेत देता है कि खरीदारों ने पूरे सत्र नियंत्रण बनाए रखा)
- मुख्य पहचान मानदंड:
- स्पष्ट डाउनट्रेंड के बाद ही बनना चाहिए
- कैंडल को अपने निचले स्तर के नजदीक खुलना चाहिए और अपने उच्च स्तर के नजदीक बंद होना चाहिए
मनोवैज्ञानिक व्याख्या
- बाजार भावना:
- पैटर्न मंदी से तेजी भावना में अचानक बदलाव को दर्शाता है
- खरीदार खुले में आक्रामक रूप से प्रवेश करते हैं, आगे गिरावट को रोकते हैं और कीमतों को ऊपर धकेलते हैं
- खरीदार/विक्रेता व्यवहार:
- मंदियां नियंत्रण खो देती हैं क्योंकि तेजियां पूरे सत्र पर हावी होती हैं, संभावित ट्रेंड उलटफेर का संकेत देती हैं
वास्तविक उदाहरण और विश्लेषण
- उदाहरण (xyz - दैनिक चार्ट):
- सेटअप: 5-दिन की गिरावट के बाद, एक बेल्ट होल्ड कैंडल बनती है, निचले स्तर पर खुलती है और उच्च स्तर के नजदीक बंद होती है
- पुष्टिकरण:
- अगली कैंडल उच्च वॉल्यूम के साथ ऊपर की दिशा में जारी रहती है, उलटफेर की पुष्टि करती है
- कीमत व्यवहार:
- xyz अगले तीन ट्रेडिंग सेशन में 6% की बढ़त दर्ज करती है
रणनीतिक अंतर्दृष्टि (व्यापारियों के अनुभव से)
प्रवेश और पुष्टि
- अधिकांश व्यापारी बेल्ट होल्ड कैंडल के बंद होने पर या फॉलो-थ्रू बुलिश कैंडल के बाद प्रवेश करते हैं
- कुछ अतिरिक्त पुष्टि के लिए कैंडल के उच्च स्तर से ऊपर ब्रेक की प्रतीक्षा करते हैं
Trigger Point और लक्ष्य
- कई Trigger Point ऑर्डर बेल्ट होल्ड कैंडल के निचले स्तर से नीचे लगाते हैं
- लाभ लक्ष्य आमतौर पर पूर्व प्रतिरोध स्तरों पर या 1:3 जोखिम-इनाम अनुपात पर सेट किए जाते हैं
जोखिम प्रबंधन सिद्धांत
- अनुभवी व्यापारी प्रति ट्रेड में 1-2% से अधिक पूंजी जोखिम नहीं लेते
- विशेषज्ञ कम तरलता अवधि (जैसे प्री-मार्केट या छुट्टियों) के दौरान ट्रेड से बचने की सलाह देते हैं
प्रो टिप्स
- वॉल्यूम महत्वपूर्ण है: खरीदारी वॉल्यूम में उछाल पैटर्न की विश्वसनीयता बढ़ाता है
- उच्च टाइमफ्रेम पर मजबूत: इंट्राडे टाइमफ्रेम की तुलना में दैनिक/साप्ताहिक चार्ट पर अधिक महत्वपूर्ण
सामान्य गलतियाँ और सावधानियां
गलत व्याख्याएं
- नए व्यापारी कभी-कभी किसी भी लंबे बुलिश कैंडल को बेल्ट होल्ड समझ लेते हैं, लेकिन ओपन निचले स्तर के नजदीक होना चाहिए
- अस्थिर या साइडवेज मार्केट में बेल्ट होल्ड पर कार्रवाई करने से अक्सर झूठे संकेत मिलते हैं
गलतियों से बचाव
- अनुभवी व्यापारी बिना पुष्टि के प्रवेश से बचते हैं
- विशेषज्ञ मजबूत सत्यापन के लिए ट्रेंडलाइन या मूविंग एवरेज के साथ संयोजन की सलाह देते हैं
विविधताएं और समान पैटर्न
समान पैटर्न
- बेल्ट होल्ड (बेयरिश): अपट्रेंड में संभावित मंदी उलटफेर का संकेत देने वाला विपरीत पैटर्न
- मारुबोजू: बिना विक्स वाला कैंडल, चरम तेजी या मंदी वर्चस्व दिखाता है
- हैमर: बेल्ट होल्ड के समान लेकिन छोटे बॉडी और लंबी निचली विक वाला
प्रश्नोत्तरी: अपना ज्ञान परखें
True or False
- सही या गलत: बुलिश बेल्ट होल्ड पैटर्न ट्रेंडिंग और रेंजिंग दोनों बाजारों में समान रूप से विश्वसनीय है।
- उत्तर: गलत - यह स्पष्ट डाउनट्रेंड में सबसे अच्छा काम करता है, अस्थिर या साइडवेज स्थितियों में नहीं।